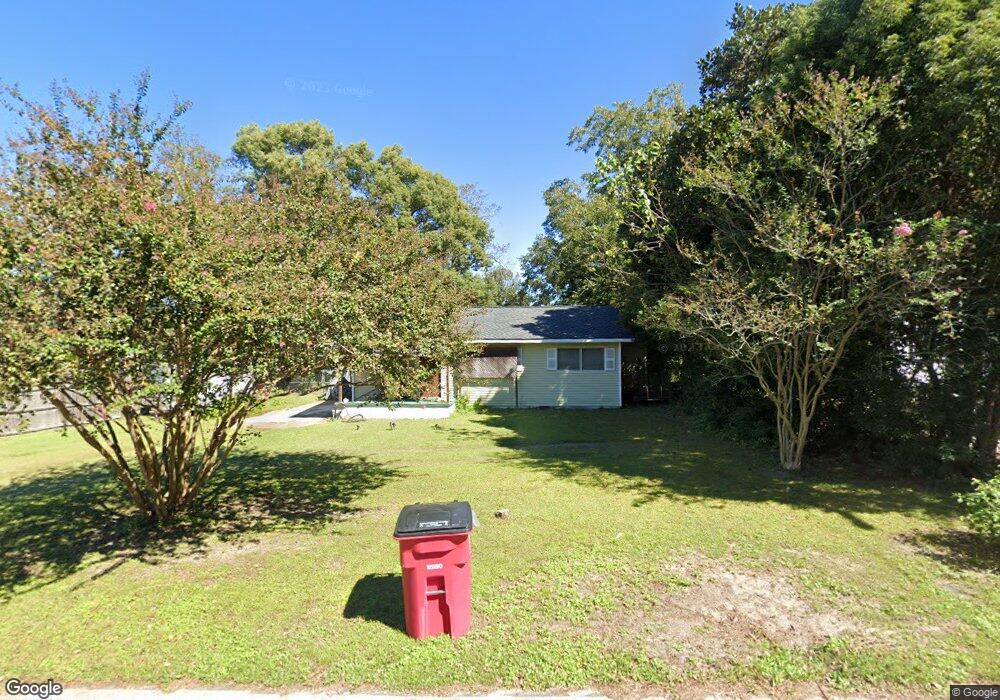
211 Darling Ave Blackshear, GA 31516
Estimated Value: $126,000 - $174,000
3
Beds
2
Baths
1,173
Sq Ft
$128/Sq Ft
Est. Value
About This Home
This home is located at 211 Darling Ave, Blackshear, GA 31516 and is currently estimated at $150,065, approximately $127 per square foot. 211 Darling Ave is a home located in Pierce County with nearby schools including Pierce County High School, Southeast Christian Academy, and Truth Christian Academy.
Ownership History
Date
Name
Owned For
Owner Type
Purchase Details
Closed on
Mar 19, 2010
Sold by
Wallace Robert E
Bought by
Stevens Matthew
Current Estimated Value
Home Financials for this Owner
Home Financials are based on the most recent Mortgage that was taken out on this home.
Original Mortgage
$58,163
Outstanding Balance
$38,110
Interest Rate
4.91%
Mortgage Type
New Conventional
Estimated Equity
$111,955
Purchase Details
Closed on
Jan 16, 1991
Sold by
Hughes William A
Bought by
Hughes Fannie R
Purchase Details
Closed on
Feb 7, 1990
Sold by
Boatright Holder and Boatright Eleanor
Bought by
Hughes William A and Hughes Fannie R
Purchase Details
Closed on
Dec 13, 1989
Sold by
Boatright Holder
Bought by
Hughes William A and Hughes Fannie R
Purchase Details
Closed on
Jun 11, 1956
Sold by
Harris Ivan T
Bought by
Boatright Holder
Purchase Details
Closed on
Nov 19, 1945
Sold by
Williamson C H Mrs
Bought by
Harris Ivan T
Create a Home Valuation Report for This Property
The Home Valuation Report is an in-depth analysis detailing your home's value as well as a comparison with similar homes in the area
Home Values in the Area
Average Home Value in this Area
Purchase History
| Date | Buyer | Sale Price | Title Company |
|---|---|---|---|
| Stevens Matthew | $57,000 | -- | |
| Hughes Fannie R | -- | -- | |
| Hughes William A | -- | -- | |
| Hughes William A | -- | -- | |
| Boatright Holder | -- | -- | |
| Harris Ivan T | -- | -- |
Source: Public Records
Mortgage History
| Date | Status | Borrower | Loan Amount |
|---|---|---|---|
| Open | Stevens Matthew | $58,163 |
Source: Public Records
Tax History
| Year | Tax Paid | Tax Assessment Tax Assessment Total Assessment is a certain percentage of the fair market value that is determined by local assessors to be the total taxable value of land and additions on the property. | Land | Improvement |
|---|---|---|---|---|
| 2025 | $1,146 | $34,722 | $2,520 | $32,202 |
| 2024 | $1,078 | $33,630 | $2,520 | $31,110 |
| 2023 | $1,043 | $32,532 | $2,520 | $30,012 |
| 2022 | $834 | $21,961 | $3,015 | $18,946 |
| 2021 | $867 | $21,207 | $3,015 | $18,192 |
| 2020 | $847 | $20,453 | $3,015 | $17,438 |
| 2019 | $847 | $20,453 | $3,015 | $17,438 |
| 2018 | $782 | $18,830 | $3,015 | $15,815 |
| 2017 | $765 | $18,377 | $3,015 | $15,362 |
| 2016 | $763 | $18,377 | $3,015 | $15,362 |
| 2015 | $666 | $19,090 | $3,015 | $16,075 |
| 2014 | $666 | $19,090 | $3,015 | $16,075 |
| 2013 | $666 | $19,090 | $3,015 | $16,075 |
Source: Public Records
Map
Nearby Homes
- 331 Central Ave W
- 6034 Turkey Oak Rd
- 241 Strickland Ave
- ST. ROUTE 121 Georgia 121
- 420 Greenleaf St
- 315 Strickland Ave
- 402 Mcgregor St
- 622 E Main St
- 543 Church St
- 106 Southern Oaks Ln
- 517 Lazy Ln
- 854 Jenkins St
- 150 Pittman St
- 121 Beaver Dr
- TBD Trudie Rd
- 918 Main St
- 915 Jane St
- 948 Azalea St
- 4096 U S 84
- 118 Pinehurst Dr
- 211 Darling St
- 219 Darling St
- 3687 Us Highway 84
- 210 Darling St
- 3689 Us Highway 84
- 214 Darling St
- 405 NE Central Ave
- 405 NE Central Ave
- 3693 Us Highway 84
- 413 NE Central Ave
- 341 NE Central Ave
- 3648 Us Highway 84
- 331 NE Central Ave
- 3667 U S 84
- 3684 Us Highway 84
- 3682 U S 84
- 3682 Us Highway 84
- 218 Sreda St
- 206 Sreda St
- 3661 Us Highway 84
Your Personal Tour Guide
Ask me questions while you tour the home.