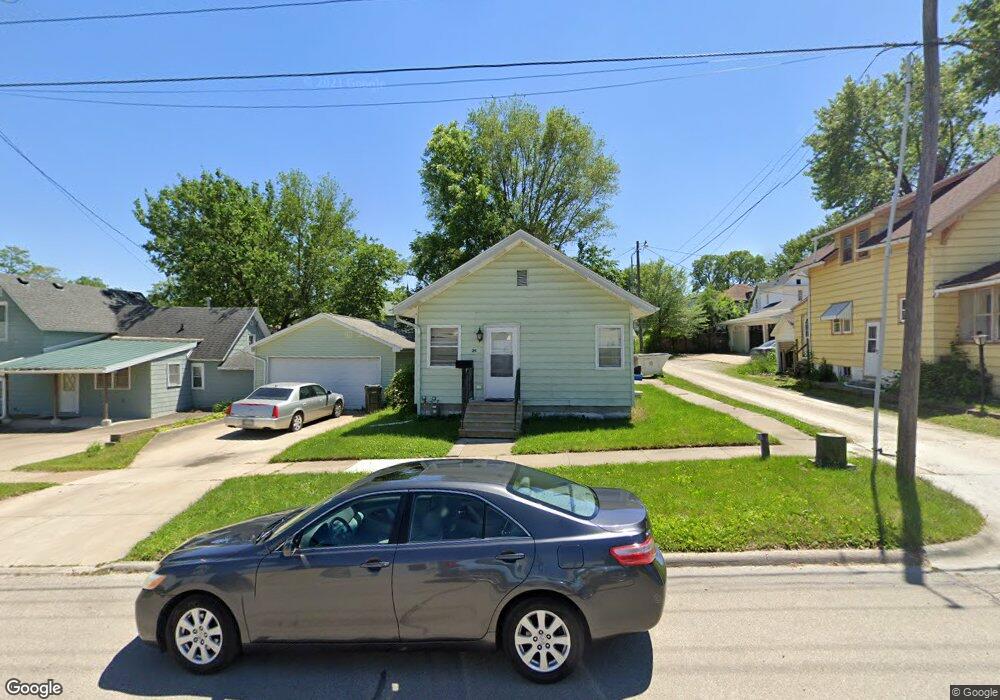
211 E 7th St Cedar Falls, IA 50613
Estimated Value: $127,000 - $137,801
2
Beds
1
Bath
760
Sq Ft
$173/Sq Ft
Est. Value
About This Home
This home is located at 211 E 7th St, Cedar Falls, IA 50613 and is currently estimated at $131,450, approximately $172 per square foot. 211 E 7th St is a home located in Black Hawk County with nearby schools including Lincoln Elementary School, Holmes Junior High School, and Cedar Falls High School.
Ownership History
Date
Name
Owned For
Owner Type
Purchase Details
Closed on
Oct 2, 2024
Sold by
Dobrila Laurentiu O and Dobrila Elena P
Bought by
Premier Cedar Valley Llc
Current Estimated Value
Purchase Details
Closed on
Feb 10, 2015
Sold by
Zimmerman Nguyen Shannon J and Zimmerman Aaron M
Bought by
Dobrila Laurentiu and Dobrila Elena
Home Financials for this Owner
Home Financials are based on the most recent Mortgage that was taken out on this home.
Original Mortgage
$65,600
Interest Rate
3.82%
Mortgage Type
New Conventional
Create a Home Valuation Report for This Property
The Home Valuation Report is an in-depth analysis detailing your home's value as well as a comparison with similar homes in the area
Home Values in the Area
Average Home Value in this Area
Purchase History
| Date | Buyer | Sale Price | Title Company |
|---|---|---|---|
| Premier Cedar Valley Llc | -- | None Listed On Document | |
| Dobrila Laurentiu | $8,812 | None Available |
Source: Public Records
Mortgage History
| Date | Status | Borrower | Loan Amount |
|---|---|---|---|
| Previous Owner | Dobrila Laurentiu | $65,600 |
Source: Public Records
Tax History
| Year | Tax Paid | Tax Assessment Tax Assessment Total Assessment is a certain percentage of the fair market value that is determined by local assessors to be the total taxable value of land and additions on the property. | Land | Improvement |
|---|---|---|---|---|
| 2025 | $1,867 | $121,510 | $31,160 | $90,350 |
| 2024 | $1,815 | $112,680 | $20,770 | $91,910 |
| 2023 | $1,749 | $112,680 | $20,770 | $91,910 |
| 2022 | $1,769 | $91,710 | $20,770 | $70,940 |
| 2021 | $1,627 | $91,710 | $20,770 | $70,940 |
| 2020 | $1,622 | $84,440 | $13,500 | $70,940 |
| 2019 | $3,084 | $84,440 | $13,500 | $70,940 |
| 2018 | $1,560 | $84,440 | $13,500 | $70,940 |
| 2017 | $1,594 | $84,440 | $13,500 | $70,940 |
| 2016 | $1,492 | $84,440 | $13,500 | $70,940 |
| 2015 | $1,492 | $84,440 | $13,500 | $70,940 |
| 2014 | $1,296 | $81,220 | $13,500 | $67,720 |
Source: Public Records
Map
Nearby Homes
- 710 Main St
- 808 Clay St
- 832 Clay St
- 603 Clay St
- 123 E 3rd St Unit 201
- 123 E 3rd St Unit 206
- 123 E 3rd St Unit 402
- 123 E 3rd St Unit 404
- 123 E 3rd St Unit 303
- 250 State St Unit 302
- 250 State St Unit 212
- 250 State St Unit 405
- 526 W 8th St
- 406 W 12th St
- 524 W 6th St
- 603 Iowa St
- 1422 Main St
- 1321 Franklin St
- 721 Olive St
- 821 College St
Your Personal Tour Guide
Ask me questions while you tour the home.