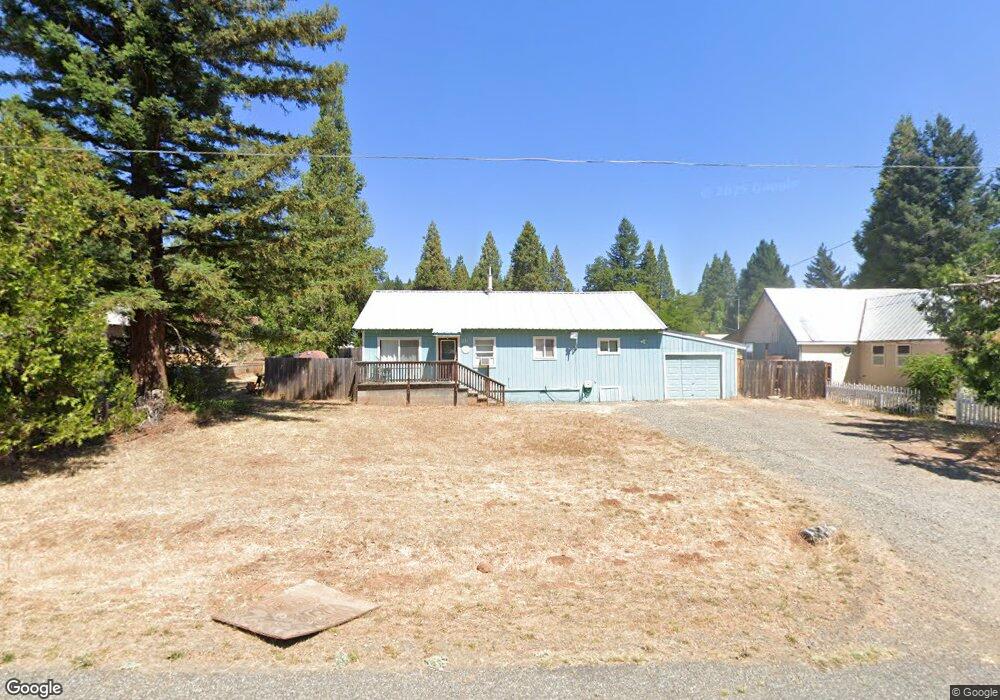
211 Trinity Vista St Trinity Center, CA 96091
Estimated Value: $193,000 - $238,000
2
Beds
1
Bath
1,039
Sq Ft
$203/Sq Ft
Est. Value
About This Home
This home is located at 211 Trinity Vista St, Trinity Center, CA 96091 and is currently estimated at $211,207, approximately $203 per square foot. 211 Trinity Vista St is a home with nearby schools including Trinity Center Elementary, Weaverville Elementary School, and Trinity High School.
Ownership History
Date
Name
Owned For
Owner Type
Purchase Details
Closed on
Jul 20, 2016
Sold by
Tilch Aaron A and Tilch Jennifer A
Bought by
Conley Tyler and Conley Teresa
Current Estimated Value
Home Financials for this Owner
Home Financials are based on the most recent Mortgage that was taken out on this home.
Original Mortgage
$135,000
Outstanding Balance
$107,422
Interest Rate
3.48%
Mortgage Type
New Conventional
Estimated Equity
$103,785
Purchase Details
Closed on
Oct 30, 2012
Sold by
Mcdonald Jerome K and Mcdonald Sandra A
Bought by
Tilch Aaron A and Tilch Jennifer A
Home Financials for this Owner
Home Financials are based on the most recent Mortgage that was taken out on this home.
Original Mortgage
$76,000
Interest Rate
3.43%
Mortgage Type
New Conventional
Purchase Details
Closed on
Aug 16, 2012
Sold by
Mcdonald Jerome K and Mc Donald Sandra A
Bought by
Mcdonald Jerome K and Mc Donald Sandra A
Purchase Details
Closed on
Jan 9, 2007
Sold by
Mcdonald John K
Bought by
Mcdonald Jerome K
Create a Home Valuation Report for This Property
The Home Valuation Report is an in-depth analysis detailing your home's value as well as a comparison with similar homes in the area
Purchase History
| Date | Buyer | Sale Price | Title Company |
|---|---|---|---|
| Conley Tyler | $150,000 | Humboldt Land Title Company | |
| Tilch Aaron A | $95,000 | Trinity Co Title Co | |
| Mcdonald Jerome K | -- | Trinity Co Title Co | |
| Mcdonald Jerome K | -- | First American Title Co |
Source: Public Records
Mortgage History
| Date | Status | Borrower | Loan Amount |
|---|---|---|---|
| Open | Conley Tyler | $135,000 | |
| Previous Owner | Tilch Aaron A | $76,000 |
Source: Public Records
Tax History
| Year | Tax Paid | Tax Assessment Tax Assessment Total Assessment is a certain percentage of the fair market value that is determined by local assessors to be the total taxable value of land and additions on the property. | Land | Improvement |
|---|---|---|---|---|
| 2025 | $1,778 | $174,082 | $34,815 | $139,267 |
| 2024 | $1,749 | $170,670 | $34,133 | $136,537 |
| 2023 | $1,749 | $167,324 | $33,464 | $133,860 |
| 2022 | $1,843 | $164,044 | $32,808 | $131,236 |
| 2021 | $1,814 | $160,828 | $32,165 | $128,663 |
| 2020 | $1,630 | $159,180 | $31,836 | $127,344 |
| 2019 | $1,598 | $156,060 | $31,212 | $124,848 |
| 2018 | $1,545 | $153,000 | $30,600 | $122,400 |
| 2017 | $1,540 | $150,000 | $30,000 | $120,000 |
| 2016 | $994 | $98,818 | $41,607 | $57,211 |
| 2015 | $978 | $97,335 | $40,983 | $56,352 |
| 2014 | $965 | $95,430 | $40,181 | $55,249 |
Source: Public Records
Map
Nearby Homes
- 71 Mary
- 230 Mary Ave
- 250 Mary Ave
- 230 N Lakeview Dr
- 220 & 230 Lakeview
- 220 & 230 Lakeview Dr
- 268 Placer Dr
- 279 Placer Dr
- 8341 E Side Rd
- 8341 E East Side Rd
- 10 Estabrook Ln
- 151 Guy Covington Dr
- 490 Bear Paw Trail
- 141 Mountain Aire Rd
- 121, 141 Mountain Aire Rd
- 121 Mountain Aire Ln
- 410 Lake Forest Dr
- 399 & 410 Lake Forest Dr
- 399 & 410 Lake Forest
- 750 & 798 Lake Forest Dr
- 225 Trinity Vista St
- 195 Trinity Vista St
- 170 Scott Blvd
- 200 Trinity Vista St
- 237 Trinity Vista St
- 150 Scott Blvd
- 180 Trinity Vista St
- 52 Scott Blvd
- 169 Trinity Vista St
- 190 Scott Blvd
- 241 Cedar Rd
- 226 Scott Blvd
- 250 Trinity Vista St
- 46 Scott Blvd
- 170 Trinity Vista St
- 191 Cedar Rd
- 261 Trinity Vista St
- 161 Trinity Vista St
- 171 Scott Blvd
Your Personal Tour Guide
Ask me questions while you tour the home.