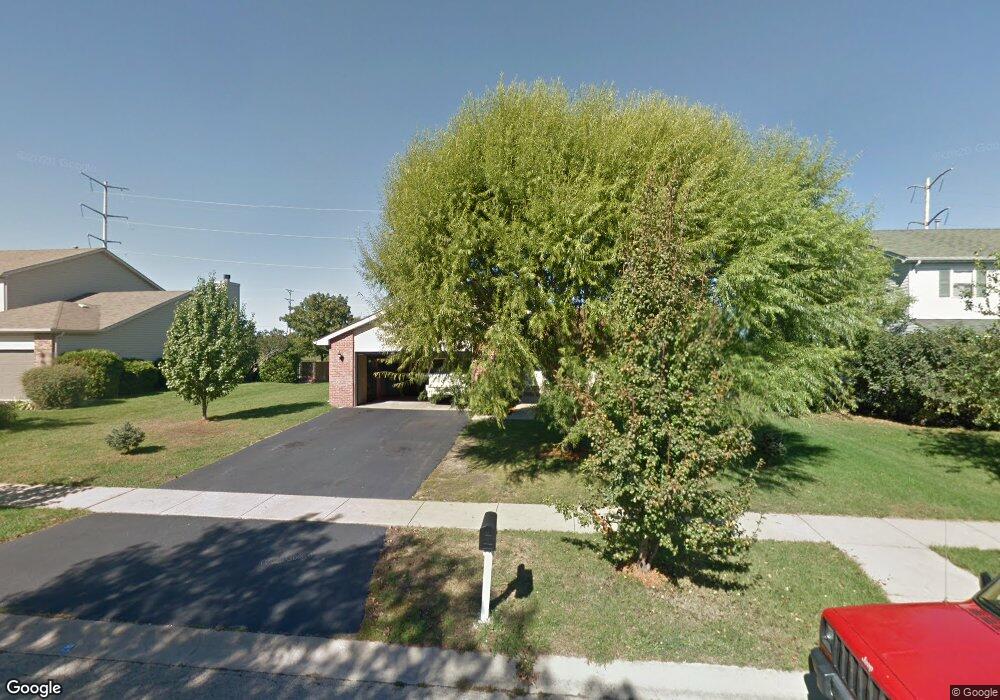
211 Wolverine Dr Unit 8 Oswego, IL 60543
Northwest Oswego NeighborhoodEstimated Value: $352,000 - $368,000
4
Beds
2
Baths
1,776
Sq Ft
$201/Sq Ft
Est. Value
About This Home
This home is located at 211 Wolverine Dr Unit 8, Oswego, IL 60543 and is currently estimated at $356,554, approximately $200 per square foot. 211 Wolverine Dr Unit 8 is a home located in Kendall County with nearby schools including Fox Chase Elementary School, Traughber Junior High School, and Oswego High School.
Ownership History
Date
Name
Owned For
Owner Type
Purchase Details
Closed on
Mar 27, 2019
Sold by
Gallo Ralph and Ineich Joann
Bought by
Wind Leeann
Current Estimated Value
Purchase Details
Closed on
Jun 10, 2002
Sold by
Gallo Ralph and Gallo Dorothy
Bought by
Gallo Ralph and Gallo Dorothy
Home Financials for this Owner
Home Financials are based on the most recent Mortgage that was taken out on this home.
Original Mortgage
$68,500
Outstanding Balance
$29,168
Interest Rate
6.91%
Estimated Equity
$327,386
Purchase Details
Closed on
Oct 2, 2001
Sold by
Gallo Ralph and Gallo Dorothy
Bought by
Gallo Ralph and Gallo Dorothy
Purchase Details
Closed on
Oct 5, 1999
Sold by
Marquette National Bank
Bought by
Gallo Ralph C and Gallo Dorothy
Home Financials for this Owner
Home Financials are based on the most recent Mortgage that was taken out on this home.
Original Mortgage
$67,000
Interest Rate
7.88%
Create a Home Valuation Report for This Property
The Home Valuation Report is an in-depth analysis detailing your home's value as well as a comparison with similar homes in the area
Home Values in the Area
Average Home Value in this Area
Purchase History
| Date | Buyer | Sale Price | Title Company |
|---|---|---|---|
| Wind Leeann | -- | Attorney | |
| Gallo Ralph | -- | Chicago Title Insurance Co | |
| Gallo Ralph | -- | -- | |
| Gallo Ralph C | $133,000 | Chicago Title Insurance Co |
Source: Public Records
Mortgage History
| Date | Status | Borrower | Loan Amount |
|---|---|---|---|
| Open | Gallo Ralph | $68,500 | |
| Closed | Gallo Ralph C | $67,000 | |
| Closed | Gallo Ralph | $40,000 |
Source: Public Records
Tax History Compared to Growth
Tax History
| Year | Tax Paid | Tax Assessment Tax Assessment Total Assessment is a certain percentage of the fair market value that is determined by local assessors to be the total taxable value of land and additions on the property. | Land | Improvement |
|---|---|---|---|---|
| 2024 | $7,552 | $100,570 | $12,019 | $88,551 |
| 2023 | $6,780 | $89,979 | $10,753 | $79,226 |
| 2022 | $6,780 | $81,688 | $9,762 | $71,926 |
| 2021 | $6,530 | $76,360 | $9,762 | $66,598 |
| 2020 | $6,310 | $73,799 | $9,762 | $64,037 |
| 2019 | $6,710 | $70,967 | $9,387 | $61,580 |
| 2018 | $6,488 | $66,007 | $9,387 | $56,620 |
| 2017 | $6,368 | $62,032 | $9,387 | $52,645 |
| 2016 | $6,055 | $57,863 | $9,387 | $48,476 |
| 2015 | $5,939 | $53,934 | $8,452 | $45,482 |
| 2014 | -- | $52,185 | $8,452 | $43,733 |
| 2013 | -- | $52,185 | $8,452 | $43,733 |
Source: Public Records
Map
Nearby Homes
- 435 Fawn Dr
- 238 Willowwood Dr
- 618 Pineridge Dr N Unit 618
- 614 Pineridge Dr N Unit 43
- 409 Fawn Dr
- 411 Bayberry Dr
- LOT 10 SW Station Dr
- 102 Mary St
- 173 Dolores St
- 424 Grape Vine Trail
- 517 Meadowwood Ln Unit 3
- 2721 Berrywood Ln
- 338 Millstream Ln Unit 1
- 3935 Havenhill Ct
- 514 Bentson St
- 158 Concord Dr S
- 537 Arbor Ln
- 4004 Shoeger Ct
- 4468 E Millbrook Cir
- 4478 E Millbrook Cir
- 209 Wolverine Dr Unit 8
- 213 Wolverine Dr
- 207 Wolverine Dr Unit 8
- 215 Wolverine Dr Unit 8
- 210 Wolverine Dr Unit 8
- 212 Wolverine Dr
- 205 Wolverine Dr
- 217 Wolverine Dr Unit 8
- 208 Wolverine Dr
- 214 Wolverine Dr Unit 1
- 206 Wolverine Dr
- 219 Wolverine Dr Unit 8
- 203 Wolverine Dr Unit 8
- 501 White Owl Ln
- 216 Wolverine Dr Unit 8
- 304 Bucktail Dr Unit 8
- 503 White Owl Ln Unit 8
- 204 Wolverine Dr
- 513 White Owl Ln
- 505 White Owl Ln Unit 8