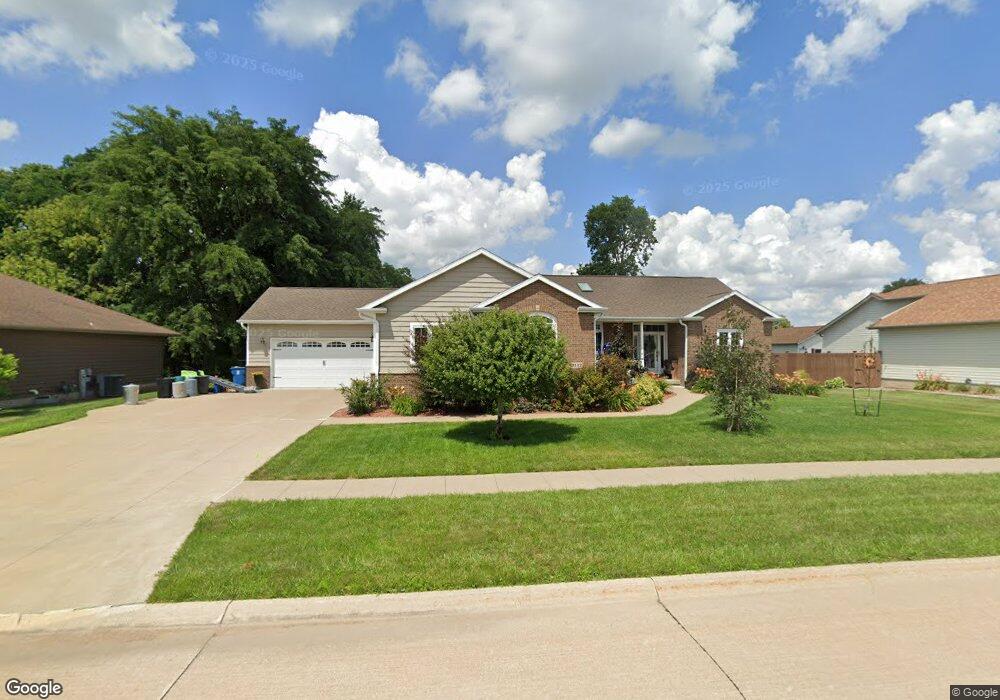
2112 12th St Camanche, IA 52730
Estimated Value: $350,000 - $415,535
3
Beds
3
Baths
1,665
Sq Ft
$236/Sq Ft
Est. Value
About This Home
This home is located at 2112 12th St, Camanche, IA 52730 and is currently estimated at $393,384, approximately $236 per square foot. 2112 12th St is a home located in Clinton County with nearby schools including Camanche Elementary School, Camanche Middle School, and Camanche High School.
Ownership History
Date
Name
Owned For
Owner Type
Purchase Details
Closed on
Aug 2, 2016
Sold by
Roth Thomas J and Roth Lisa A
Bought by
Turner Christopher J and Turner Kayleen B
Current Estimated Value
Home Financials for this Owner
Home Financials are based on the most recent Mortgage that was taken out on this home.
Original Mortgage
$244,800
Outstanding Balance
$194,346
Interest Rate
3.41%
Mortgage Type
New Conventional
Estimated Equity
$199,038
Purchase Details
Closed on
Dec 28, 2009
Sold by
Edens Robert J and Edens Jennifer L
Bought by
Roth Thomas J and Roth Ruth Lisa
Purchase Details
Closed on
Jun 6, 2007
Sold by
Murphy Alan D and Murphy Bonnie R
Bought by
Edens Robert J and Edens Jennifer L
Create a Home Valuation Report for This Property
The Home Valuation Report is an in-depth analysis detailing your home's value as well as a comparison with similar homes in the area
Home Values in the Area
Average Home Value in this Area
Purchase History
| Date | Buyer | Sale Price | Title Company |
|---|---|---|---|
| Turner Christopher J | $272,000 | None Available | |
| Roth Thomas J | $30,000 | None Available | |
| Edens Robert J | $27,500 | None Available |
Source: Public Records
Mortgage History
| Date | Status | Borrower | Loan Amount |
|---|---|---|---|
| Open | Turner Christopher J | $244,800 |
Source: Public Records
Tax History Compared to Growth
Tax History
| Year | Tax Paid | Tax Assessment Tax Assessment Total Assessment is a certain percentage of the fair market value that is determined by local assessors to be the total taxable value of land and additions on the property. | Land | Improvement |
|---|---|---|---|---|
| 2025 | $6,920 | $412,850 | $36,750 | $376,100 |
| 2024 | $6,920 | $377,350 | $36,750 | $340,600 |
| 2023 | $6,672 | $377,350 | $36,750 | $340,600 |
| 2022 | $5,788 | $334,870 | $36,750 | $298,120 |
| 2021 | $5,588 | $289,360 | $34,130 | $255,230 |
| 2020 | $5,588 | $275,930 | $34,130 | $241,800 |
| 2019 | $4,896 | $262,490 | $0 | $0 |
| 2018 | $5,080 | $262,490 | $0 | $0 |
| 2017 | $5,276 | $262,490 | $0 | $0 |
| 2016 | $4,934 | $259,160 | $0 | $0 |
| 2015 | $4,934 | $259,160 | $0 | $0 |
| 2014 | $5,000 | $259,160 | $0 | $0 |
| 2013 | $5,096 | $0 | $0 | $0 |
Source: Public Records
Map
Nearby Homes