
2112 Saint James Rd Raleigh, NC 27607
Sunset Hills NeighborhoodEstimated payment $5,710/month
Highlights
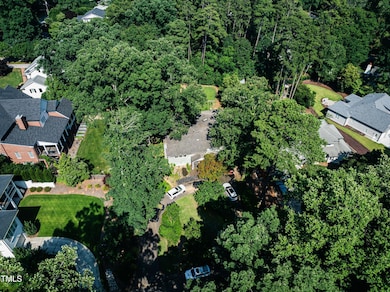
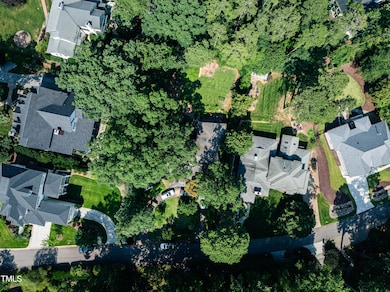
- 0.46 Acre Lot
- Partially Wooded Lot
- No HOA
- Lacy Elementary Rated A
About This Lot
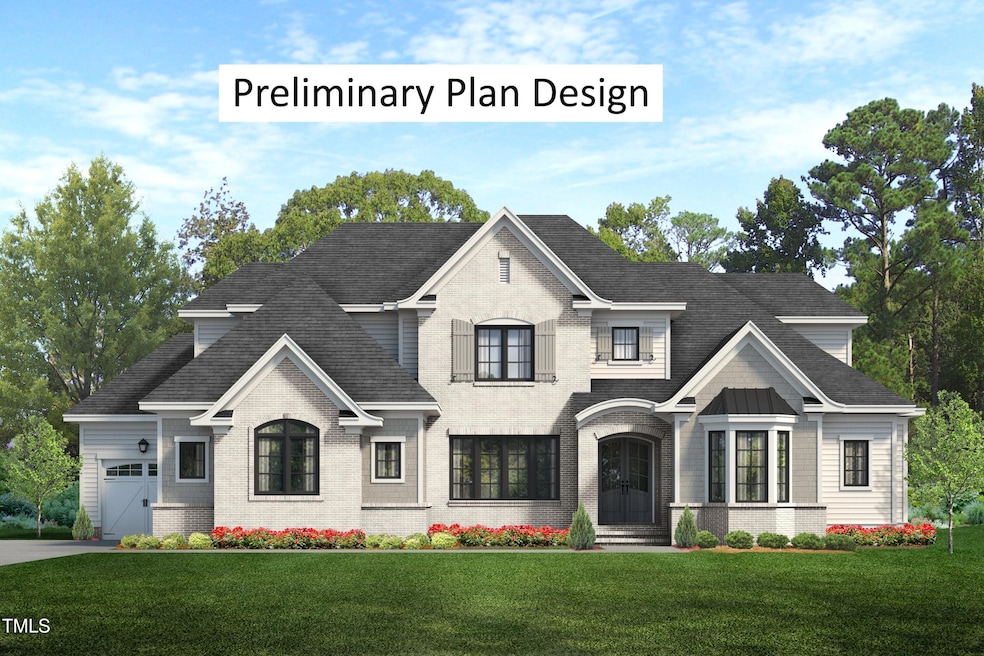
Custom Pre-Sale Opportunity with award-winning Exeter Building Company.
Co-Listing Agent
Shelley Caldwell
Beacon Realty License #128848
Property Details
Property Type
- Land
Est. Annual Taxes
- $9,905
Lot Details
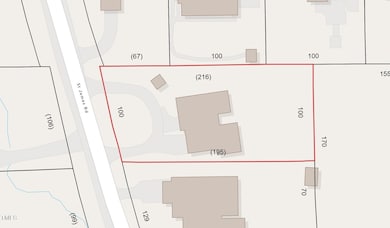
- 0.46 Acre Lot
- Lot Dimensions are 100x200
- Partially Wooded Lot
- Property is zoned R-4
Schools
- Lacy Elementary School
- Martin Middle School
- Broughton High School
Utilities
- Underground Utilities
Community Details
- No Home Owners Association
- Budleigh Subdivision
Listing and Financial Details
- Assessor Parcel Number 0795720822
Map
Home Values in the Area
Average Home Value in this Area
Tax History
| Year | Tax Paid | Tax Assessment Tax Assessment Total Assessment is a certain percentage of the fair market value that is determined by local assessors to be the total taxable value of land and additions on the property. | Land | Improvement |
|---|---|---|---|---|
| 2025 | -- | $949,395 | $855,000 | $94,395 |
| 2024 | $9,905 | $1,138,186 | $855,000 | $283,186 |
| 2023 | $7,890 | $722,051 | $500,000 | $222,051 |
| 2022 | $7,331 | $722,051 | $500,000 | $222,051 |
| 2021 | $7,046 | $722,051 | $500,000 | $222,051 |
| 2020 | $6,917 | $722,051 | $500,000 | $222,051 |
| 2019 | $7,703 | $662,937 | $356,500 | $306,437 |
| 2018 | $7,263 | $662,937 | $356,500 | $306,437 |
| 2017 | $6,917 | $662,937 | $356,500 | $306,437 |
| 2016 | $6,774 | $662,937 | $356,500 | $306,437 |
| 2015 | $5,899 | $567,764 | $326,600 | $241,164 |
| 2014 | $5,594 | $567,764 | $326,600 | $241,164 |
Property History
| Date | Event | Price | List to Sale | Price per Sq Ft |
|---|---|---|---|---|
| 08/19/2025 08/19/25 | For Sale | $925,000 | -- | -- |
Purchase History
| Date | Type | Sale Price | Title Company |
|---|---|---|---|
| Warranty Deed | $862,000 | None Listed On Document | |
| Warranty Deed | $862,000 | None Listed On Document | |
| Warranty Deed | $535,000 | None Available |
Mortgage History
| Date | Status | Loan Amount | Loan Type |
|---|---|---|---|
| Previous Owner | $80,250 | Unknown | |
| Previous Owner | $401,250 | New Conventional |
Source: Doorify MLS
MLS Number: 10116719
APN: 0795.15-72-0822-000
Disclaimer: Certain information contained herein is derived from information provided by parties other than Homes.com. All information provided is deemed reliable, but is not guaranteed to be accurate and should be independently verified.
![]() Some IDX listings have been excluded from this IDX display. Brokers make an effort to deliver accurate information, but buyers should independently verify any information on which they will rely in a transaction. The listing broker shall not be responsible for any typographical errors, misinformation, or misprints, and they shall be held totally harmless from any damages arising from reliance upon this data. This data is provided exclusively for consumers’ personal, non-commercial use. Listings marked with an icon are provided courtesy of the Doorify MLS, Inc. of North Carolina, Internet Data Exchange Database. Closed (sold) listings may have been listed and/or sold by a real estate firm other than the firm(s) featured on this website. Closed data is not available until the sale of the property is recorded in the MLS. Home sale data is not an appraisal, CMA, competitive or comparative market analysis, or home valuation of any property. Copyright 2025 Doorify MLS, Inc. of North Carolina. All rights reserved.
Some IDX listings have been excluded from this IDX display. Brokers make an effort to deliver accurate information, but buyers should independently verify any information on which they will rely in a transaction. The listing broker shall not be responsible for any typographical errors, misinformation, or misprints, and they shall be held totally harmless from any damages arising from reliance upon this data. This data is provided exclusively for consumers’ personal, non-commercial use. Listings marked with an icon are provided courtesy of the Doorify MLS, Inc. of North Carolina, Internet Data Exchange Database. Closed (sold) listings may have been listed and/or sold by a real estate firm other than the firm(s) featured on this website. Closed data is not available until the sale of the property is recorded in the MLS. Home sale data is not an appraisal, CMA, competitive or comparative market analysis, or home valuation of any property. Copyright 2025 Doorify MLS, Inc. of North Carolina. All rights reserved.
- 2211 Wheeler Rd
- 2125 Buckingham Rd
- 2227 Wheeler Rd
- 2217 Coley Forest Place
- 2108 Ridge Rd
- 504 Yarmouth Rd
- 2128 Ridge Rd
- 3005 Woodgreen Dr
- 435 Yarmouth Rd
- 500 Lake Boone Trail
- 1009 Westwood Dr
- 3016 Devonshire Dr
- 100 Edenburgh Rd Unit 202
- 109 Edenburgh Rd
- 105 Edenburgh Rd
- 1521 Canterbury Rd
- 3349 Hampton Rd
- 3351 Hampton Rd
- 3359 Hampton Rd
- 3303 Ridgecrest Ct
- 3304 Boulder Ct
- 3021 Medlin Dr Unit E
- 2120 Kipawa St
- 2702 Cartier Dr
- 2824 Wayland Dr
- 1651 Village Glenn Dr
- 1667 Village Glenn Dr
- 3939 Glenwood Ave
- 3711 Exchange Glenwood Place
- 1731 Tupelo Hill Ln
- 3310 Womans Club Dr
- 3950 Fairsted Dr
- 912 Dixie Trail
- 3709 Nova Star Ln Unit Garrison
- 3709 Nova Star Ln Unit Nash
- 3709 Nova Star Ln Unit Grady
- 2808 Glen Burnie Dr
- 3709 Nova Star Ln
- 3449 Bradley Place
- 5500 Home Valley Dr
