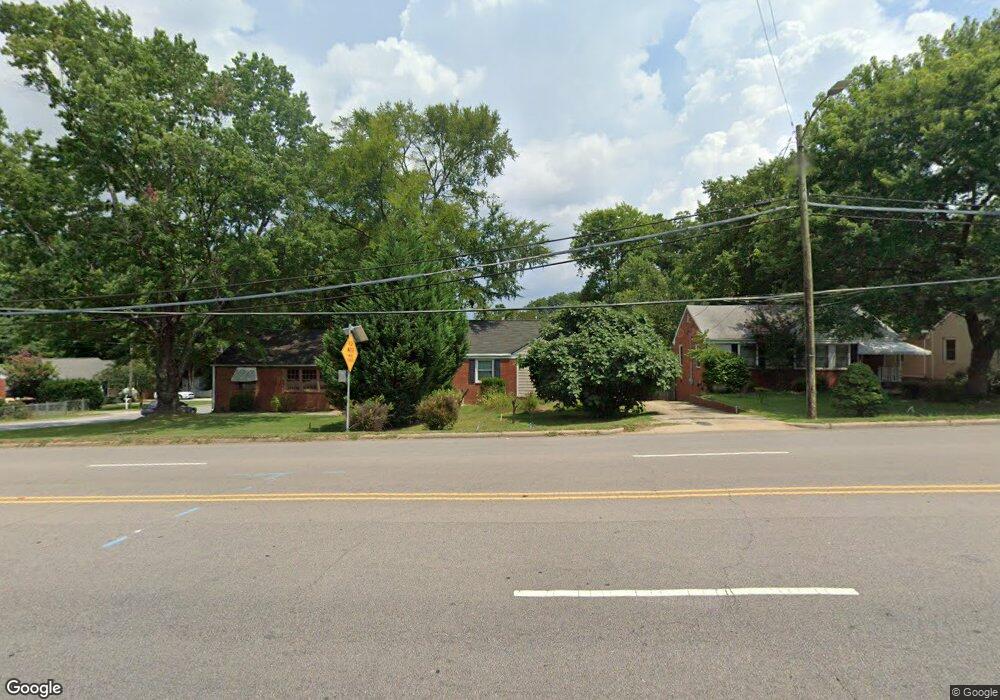
2112 Wake Forest Rd Raleigh, NC 27608
Estimated Value: $370,000 - $451,000
2
Beds
1
Bath
895
Sq Ft
$467/Sq Ft
Est. Value
About This Home
This home is located at 2112 Wake Forest Rd, Raleigh, NC 27608 and is currently estimated at $418,224, approximately $467 per square foot. 2112 Wake Forest Rd is a home located in Wake County with nearby schools including Joyner Elementary School, Oberlin Middle School, and Broughton Magnet High School.
Ownership History
Date
Name
Owned For
Owner Type
Purchase Details
Closed on
Feb 27, 2009
Sold by
Hughes Kyle Porter and Calix Alexandra Roberta
Bought by
Szontagh Brian J
Current Estimated Value
Home Financials for this Owner
Home Financials are based on the most recent Mortgage that was taken out on this home.
Original Mortgage
$146,520
Outstanding Balance
$92,672
Interest Rate
5.03%
Mortgage Type
FHA
Estimated Equity
$325,552
Purchase Details
Closed on
May 30, 2003
Sold by
Gephart Richard M
Bought by
Hughes Kyle Porter
Home Financials for this Owner
Home Financials are based on the most recent Mortgage that was taken out on this home.
Original Mortgage
$100,000
Interest Rate
5.79%
Mortgage Type
Balloon
Purchase Details
Closed on
Apr 26, 2000
Sold by
Wachovia Bank Na and Hailey Harry S
Bought by
Gephart Richard M
Home Financials for this Owner
Home Financials are based on the most recent Mortgage that was taken out on this home.
Original Mortgage
$73,150
Interest Rate
8.24%
Create a Home Valuation Report for This Property
The Home Valuation Report is an in-depth analysis detailing your home's value as well as a comparison with similar homes in the area
Home Values in the Area
Average Home Value in this Area
Purchase History
| Date | Buyer | Sale Price | Title Company |
|---|---|---|---|
| Szontagh Brian J | $160,000 | None Available | |
| Hughes Kyle Porter | $130,000 | -- | |
| Gephart Richard M | $77,000 | -- |
Source: Public Records
Mortgage History
| Date | Status | Borrower | Loan Amount |
|---|---|---|---|
| Open | Szontagh Brian J | $146,520 | |
| Previous Owner | Hughes Kyle Porter | $100,000 | |
| Previous Owner | Gephart Richard M | $73,150 |
Source: Public Records
Tax History Compared to Growth
Tax History
| Year | Tax Paid | Tax Assessment Tax Assessment Total Assessment is a certain percentage of the fair market value that is determined by local assessors to be the total taxable value of land and additions on the property. | Land | Improvement |
|---|---|---|---|---|
| 2025 | $2,964 | $337,552 | $206,500 | $131,052 |
| 2024 | $2,952 | $337,552 | $206,500 | $131,052 |
| 2023 | $2,357 | $214,415 | $115,500 | $98,915 |
| 2022 | $2,191 | $214,415 | $115,500 | $98,915 |
| 2021 | $2,106 | $214,415 | $115,500 | $98,915 |
| 2020 | $2,068 | $214,415 | $115,500 | $98,915 |
| 2019 | $1,782 | $152,041 | $77,000 | $75,041 |
| 2018 | $1,681 | $152,041 | $77,000 | $75,041 |
| 2017 | $1,602 | $152,041 | $77,000 | $75,041 |
| 2016 | $1,569 | $152,041 | $77,000 | $75,041 |
| 2015 | $1,543 | $147,069 | $86,900 | $60,169 |
| 2014 | -- | $147,069 | $86,900 | $60,169 |
Source: Public Records
Map
Nearby Homes
- 2100 Ann St
- 709 Mills St
- 814 Cotton Exchange Ct
- 604 Mills St
- 525 Peebles St
- 1813 Ridley St
- 521 Peebles St
- 621 Fallon Grove Way
- 1807 Ridley St
- 711 New Rd
- 1804 Pershing Rd
- 2613 Mcneil St Unit B
- 2613 Mcneil St Unit A
- 1802 Pershing Rd
- 1800 Pershing Rd
- 1806 Pershing Rd
- 757 Fallon Grove Way
- 540 Ledbetter Ct
- 627 New Rd
- 627 Georgetown Rd
- 2108 Wake Forest Rd
- 2116 Wake Forest Rd
- 2104 Wake Forest Rd
- 808 Young St
- 2040 Wake Forest Rd
- 2028 Wake Forest Rd
- 2028 Wake Forest Rd Unit 5 & pt 6
- 2040 Wake Forest Rd Unit 10
- 2216 Wake Forest Rd
- 2224 Wake Forest Rd
- 812 Young St
- 805 Mills St
- 2200 Wake Forest Rd
- 805 Young St
- 816 Young St
- 741 Mial St
- 809 Mills St
- 820 Young St
- 809 Young St
- 2208 Wake Forest Rd