
Seller's Agent in 2023
John Gluch
eXp Realty
(480) 405-5625
33 in this area
560 Total Sales

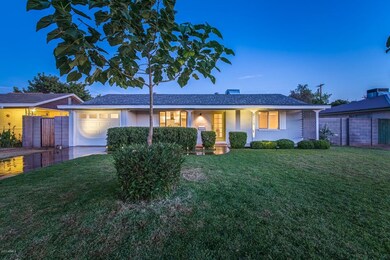
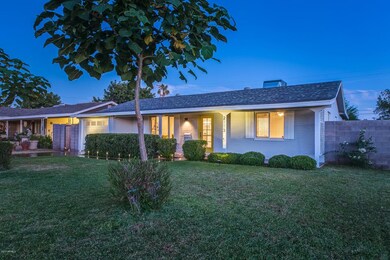
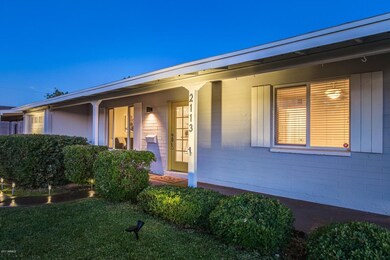
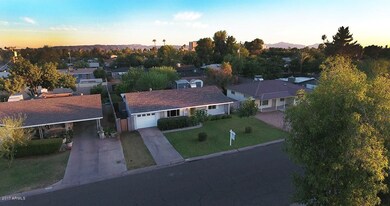
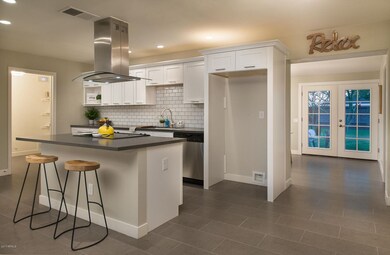
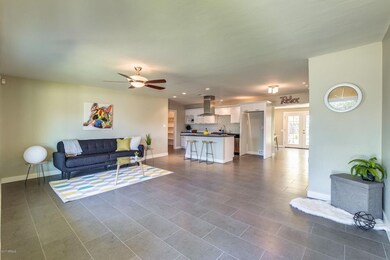
Completely remodeled mid-century beauty located in the perfect spot, close to all in the Camelback Cooridor! 4 bed, 2 bath, 1 car garage and storage building. Electrical panel replaced 2017! Majority of electrical updated 2017! Split floorplan features all new tile, paint, carpet, doors, windows, and more! Kitchen has it all.. quartz countertops, slow close cabinets, subway tile backsplash, and stainless steel appliances. Nearly 9000 sqft lot with tons of grass, mature fruit and palo verde trees, and an RV gate. So charming and ready for her new owner!
Last Agent to Sell the Property
My Home Group Real Estate License #SA646366000 Listed on: 06/16/2017
| Date | Type | Sale Price | Title Company |
|---|---|---|---|
| Warranty Deed | $535,000 | Old Republic Title Agency | |
| Warranty Deed | $367,000 | First American Title Insuran | |
| Cash Sale Deed | $195,000 | Lawyers Title Of Arizona Inc | |
| Interfamily Deed Transfer | -- | None Available | |
| Interfamily Deed Transfer | -- | Fidelity Natl Title Ins Co | |
| Warranty Deed | $85,568 | Fidelity Natl Title Ins Co | |
| Warranty Deed | $220,000 | Title Guaranty Agency Az Inc | |
| Interfamily Deed Transfer | -- | -- | |
| Warranty Deed | $84,900 | Transnation Title Insurance |
| Date | Status | Loan Amount | Loan Type |
|---|---|---|---|
| Open | $508,250 | New Conventional | |
| Previous Owner | $330,300 | New Conventional | |
| Previous Owner | $68,454 | New Conventional | |
| Previous Owner | $220,000 | New Conventional | |
| Previous Owner | $76,400 | Seller Take Back |
| Date | Event | Price | Change | Sq Ft Price |
|---|---|---|---|---|
| 08/01/2023 08/01/23 | Sold | $535,000 | 0.0% | $317 / Sq Ft |
| 06/29/2023 06/29/23 | Price Changed | $534,999 | -2.7% | $317 / Sq Ft |
| 06/22/2023 06/22/23 | Price Changed | $549,949 | 0.0% | $326 / Sq Ft |
| 06/15/2023 06/15/23 | Price Changed | $549,999 | -4.3% | $326 / Sq Ft |
| 06/01/2023 06/01/23 | Price Changed | $574,949 | 0.0% | $341 / Sq Ft |
| 05/25/2023 05/25/23 | Price Changed | $574,999 | -2.5% | $341 / Sq Ft |
| 05/18/2023 05/18/23 | Price Changed | $589,949 | 0.0% | $350 / Sq Ft |
| 05/12/2023 05/12/23 | Price Changed | $589,999 | -1.7% | $350 / Sq Ft |
| 05/04/2023 05/04/23 | Price Changed | $599,899 | 0.0% | $356 / Sq Ft |
| 04/27/2023 04/27/23 | Price Changed | $599,949 | 0.0% | $356 / Sq Ft |
| 04/21/2023 04/21/23 | Price Changed | $599,999 | -3.2% | $356 / Sq Ft |
| 04/14/2023 04/14/23 | Price Changed | $619,949 | 0.0% | $368 / Sq Ft |
| 04/05/2023 04/05/23 | Price Changed | $619,999 | -2.3% | $368 / Sq Ft |
| 03/30/2023 03/30/23 | Price Changed | $634,899 | 0.0% | $377 / Sq Ft |
| 03/23/2023 03/23/23 | Price Changed | $634,949 | 0.0% | $377 / Sq Ft |
| 03/16/2023 03/16/23 | Price Changed | $634,999 | -2.3% | $377 / Sq Ft |
| 03/09/2023 03/09/23 | Price Changed | $649,899 | 0.0% | $385 / Sq Ft |
| 03/02/2023 03/02/23 | Price Changed | $649,949 | 0.0% | $385 / Sq Ft |
| 02/23/2023 02/23/23 | Price Changed | $649,999 | -2.2% | $386 / Sq Ft |
| 02/16/2023 02/16/23 | Price Changed | $664,949 | 0.0% | $394 / Sq Ft |
| 02/04/2023 02/04/23 | Price Changed | $664,999 | -2.2% | $394 / Sq Ft |
| 01/26/2023 01/26/23 | Price Changed | $679,899 | 0.0% | $403 / Sq Ft |
| 01/19/2023 01/19/23 | Price Changed | $679,949 | 0.0% | $403 / Sq Ft |
| 01/12/2023 01/12/23 | For Sale | $679,999 | +85.3% | $403 / Sq Ft |
| 08/22/2017 08/22/17 | Sold | $367,000 | 0.0% | $212 / Sq Ft |
| 07/10/2017 07/10/17 | Price Changed | $367,000 | +0.6% | $212 / Sq Ft |
| 06/15/2017 06/15/17 | For Sale | $364,900 | -- | $210 / Sq Ft |
| Year | Tax Paid | Tax Assessment Tax Assessment Total Assessment is a certain percentage of the fair market value that is determined by local assessors to be the total taxable value of land and additions on the property. | Land | Improvement |
|---|---|---|---|---|
| 2025 | $2,566 | $22,341 | -- | -- |
| 2024 | $2,536 | $21,278 | -- | -- |
| 2023 | $2,536 | $43,060 | $8,610 | $34,450 |
| 2022 | $2,428 | $32,350 | $6,470 | $25,880 |
| 2021 | $2,519 | $29,750 | $5,950 | $23,800 |
| 2020 | $2,453 | $27,030 | $5,400 | $21,630 |
| 2019 | $2,439 | $24,030 | $4,800 | $19,230 |
| 2018 | $2,386 | $16,200 | $3,240 | $12,960 |
| 2017 | $1,341 | $14,180 | $2,830 | $11,350 |
| 2016 | $1,142 | $11,330 | $2,260 | $9,070 |
| 2015 | $1,065 | $10,450 | $2,090 | $8,360 |
Seller's Agent in 2023
John Gluch
eXp Realty
(480) 405-5625
33 in this area
560 Total Sales
Seller Co-Listing Agent in 2023
Garett Chatham
eXp Realty
(480) 656-1641
12 in this area
129 Total Sales
Buyer's Agent in 2023
Aaron Carter
Compass
(480) 236-3103
26 in this area
146 Total Sales
Buyer Co-Listing Agent in 2023
Michael Mosier
Compass
(602) 295-8074
24 in this area
133 Total Sales
Seller's Agent in 2017
Brittany Celaya
My Home Group
(602) 653-0375
21 in this area
116 Total Sales
Source: Arizona Regional Multiple Listing Service (ARMLS)
MLS Number: 5620626
APN: 119-22-044
Disclaimer: Certain information contained herein is derived from information provided by parties other than Homes.com. All information provided is deemed reliable, but is not guaranteed to be accurate and should be independently verified.
![]() All information should be verified by the recipient and none is guaranteed as accurate by ARMLS
All information should be verified by the recipient and none is guaranteed as accurate by ARMLS
Listing Information presented by local MLS brokerage: Ten-X, local REALTOR®- Arlene Richardson - (888)-952-6393