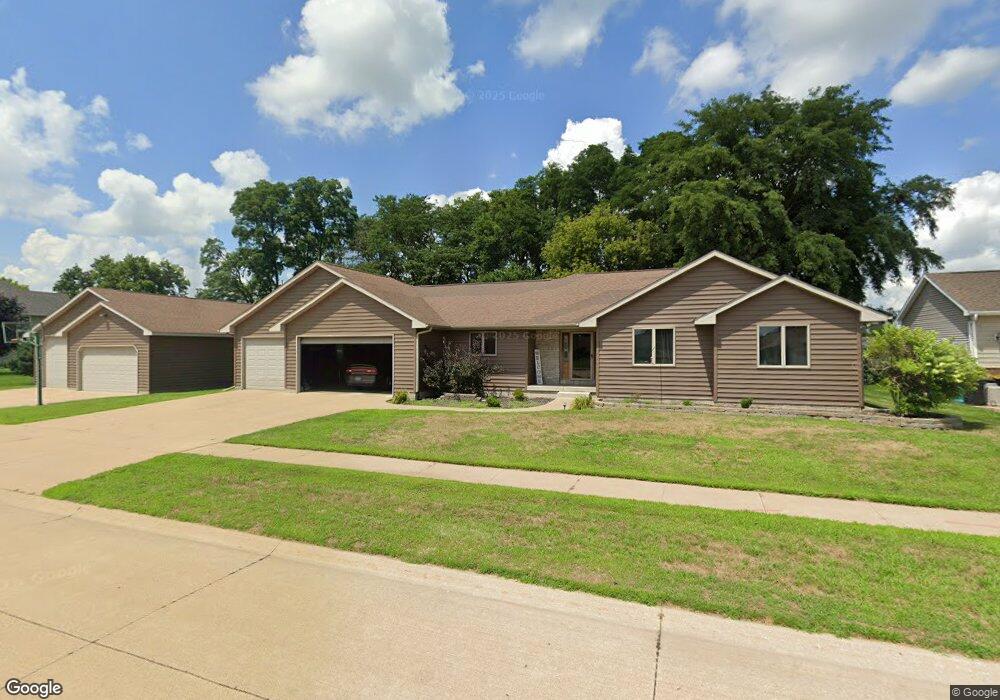
2116 12th St Camanche, IA 52730
Estimated Value: $301,000 - $407,750
3
Beds
3
Baths
1,785
Sq Ft
$204/Sq Ft
Est. Value
About This Home
This home is located at 2116 12th St, Camanche, IA 52730 and is currently estimated at $363,688, approximately $203 per square foot. 2116 12th St is a home located in Clinton County with nearby schools including Camanche Elementary School, Camanche Middle School, and Camanche High School.
Ownership History
Date
Name
Owned For
Owner Type
Purchase Details
Closed on
Jun 25, 2022
Sold by
Schoening Sherry L
Bought by
Everson Tricia A
Current Estimated Value
Purchase Details
Closed on
Dec 19, 2007
Sold by
Murphy Alan D and Murphy Bonnie R
Bought by
Everson Wade C and Everson Tricia A
Purchase Details
Closed on
Dec 8, 2005
Sold by
Murphy Alan D and Murphy Bonnie R
Bought by
Everson Wade C and Everson Tricia A
Home Financials for this Owner
Home Financials are based on the most recent Mortgage that was taken out on this home.
Original Mortgage
$153,600
Interest Rate
6.48%
Mortgage Type
FHA
Create a Home Valuation Report for This Property
The Home Valuation Report is an in-depth analysis detailing your home's value as well as a comparison with similar homes in the area
Home Values in the Area
Average Home Value in this Area
Purchase History
| Date | Buyer | Sale Price | Title Company |
|---|---|---|---|
| Everson Tricia A | -- | None Listed On Document | |
| Everson Wade C | $14,000 | None Available | |
| Everson Wade C | $27,500 | None Available |
Source: Public Records
Mortgage History
| Date | Status | Borrower | Loan Amount |
|---|---|---|---|
| Previous Owner | Everson Wade C | $153,600 |
Source: Public Records
Tax History Compared to Growth
Tax History
| Year | Tax Paid | Tax Assessment Tax Assessment Total Assessment is a certain percentage of the fair market value that is determined by local assessors to be the total taxable value of land and additions on the property. | Land | Improvement |
|---|---|---|---|---|
| 2025 | $6,634 | $393,900 | $44,100 | $349,800 |
| 2024 | $6,634 | $362,200 | $44,100 | $318,100 |
| 2023 | $6,396 | $362,200 | $44,100 | $318,100 |
| 2022 | $5,708 | $319,750 | $44,100 | $275,650 |
| 2021 | $5,528 | $285,440 | $51,190 | $234,250 |
| 2020 | $5,528 | $273,110 | $51,190 | $221,920 |
| 2019 | $4,862 | $260,780 | $0 | $0 |
| 2018 | $5,060 | $260,780 | $0 | $0 |
| 2017 | $5,090 | $261,460 | $0 | $0 |
| 2016 | $4,762 | $250,360 | $0 | $0 |
| 2015 | $4,762 | $250,360 | $0 | $0 |
| 2014 | $4,824 | $250,360 | $0 | $0 |
| 2013 | $4,748 | $0 | $0 | $0 |
Source: Public Records
Map
Nearby Homes