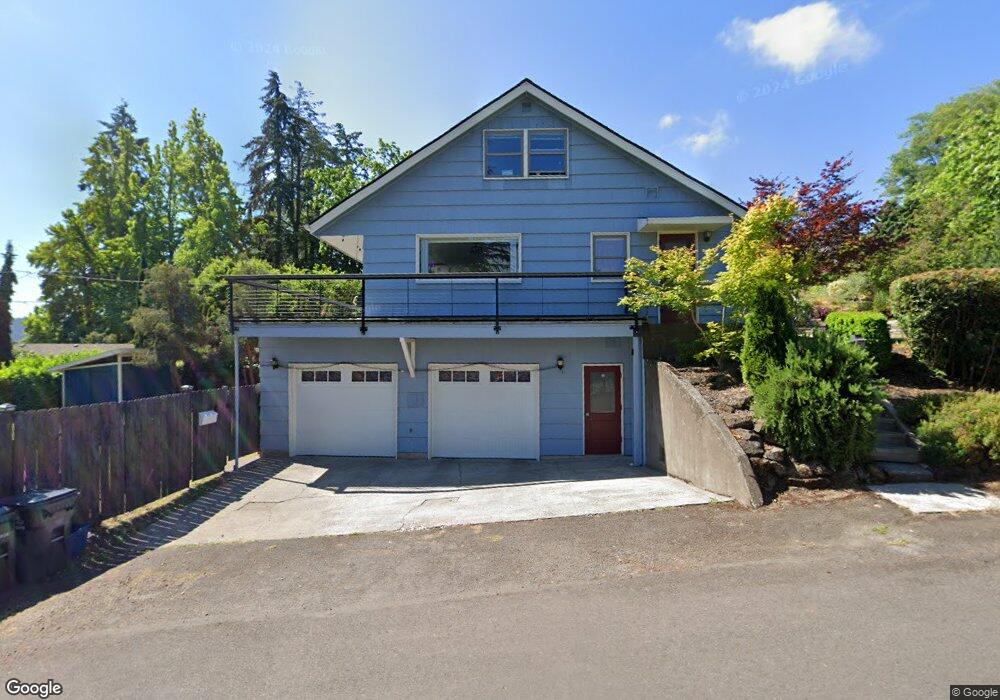
2117 Olive St Eugene, OR 97405
Friendly NeighborhoodEstimated Value: $794,718 - $917,000
4
Beds
2
Baths
2,954
Sq Ft
$290/Sq Ft
Est. Value
About This Home
This home is located at 2117 Olive St, Eugene, OR 97405 and is currently estimated at $855,930, approximately $289 per square foot. 2117 Olive St is a home located in Lane County with nearby schools including Adams Elementary School, Roosevelt Middle School, and South Eugene High School.
Ownership History
Date
Name
Owned For
Owner Type
Purchase Details
Closed on
Nov 30, 2016
Sold by
Lessel Matthew Lee and Lessel Mark Lynn
Bought by
Stewart Marian B
Current Estimated Value
Purchase Details
Closed on
Nov 9, 2010
Sold by
Lessel John L
Bought by
Lessel John L and The Lessel Living Trust
Home Financials for this Owner
Home Financials are based on the most recent Mortgage that was taken out on this home.
Original Mortgage
$126,000
Interest Rate
4.31%
Mortgage Type
New Conventional
Purchase Details
Closed on
Oct 15, 2010
Sold by
Lessel John L
Bought by
Lessel John L
Home Financials for this Owner
Home Financials are based on the most recent Mortgage that was taken out on this home.
Original Mortgage
$126,000
Interest Rate
4.31%
Mortgage Type
New Conventional
Purchase Details
Closed on
Mar 31, 1999
Sold by
Lessel John L and Lessel Jeanne J
Bought by
Lessel John L and Lessel Jeanne J
Create a Home Valuation Report for This Property
The Home Valuation Report is an in-depth analysis detailing your home's value as well as a comparison with similar homes in the area
Home Values in the Area
Average Home Value in this Area
Purchase History
| Date | Buyer | Sale Price | Title Company |
|---|---|---|---|
| Stewart Marian B | $475,000 | First American Title | |
| Lessel John L | -- | None Available | |
| Lessel John L | -- | Cascade Title Company | |
| Lessel John L | -- | -- |
Source: Public Records
Mortgage History
| Date | Status | Borrower | Loan Amount |
|---|---|---|---|
| Previous Owner | Lessel John L | $126,000 |
Source: Public Records
Tax History
| Year | Tax Paid | Tax Assessment Tax Assessment Total Assessment is a certain percentage of the fair market value that is determined by local assessors to be the total taxable value of land and additions on the property. | Land | Improvement |
|---|---|---|---|---|
| 2025 | $10,337 | $530,527 | -- | -- |
| 2024 | $10,208 | $515,075 | -- | -- |
| 2023 | $10,208 | $500,073 | -- | -- |
| 2022 | $8,931 | $453,409 | $0 | $0 |
| 2021 | $8,388 | $440,203 | $0 | $0 |
| 2020 | $8,418 | $427,382 | $0 | $0 |
| 2019 | $8,130 | $414,934 | $0 | $0 |
| 2018 | $7,004 | $326,857 | $0 | $0 |
| 2017 | $6,109 | $326,857 | $0 | $0 |
| 2016 | $5,553 | $295,809 | $0 | $0 |
| 2015 | $5,382 | $287,193 | $0 | $0 |
| 2014 | $5,285 | $278,828 | $0 | $0 |
Source: Public Records
Map
Nearby Homes
- 2031 Olive St
- 177 E 20th Ave
- 193 E 20th Ave
- 181 Civic Dr
- 1857 Pearl St
- 1673 Olive Aly
- 557 W 19th Ave
- 1826 Mill St
- 1733 Mill Aly
- 1600 Pearl St Unit 608
- 1492 Pearl St
- 0 Monroe St Unit 343774498
- 1375 Olive St Unit 503
- 84 W 27th Ave
- 1313 Lincoln St Unit 503
- 1313 Lincoln St Unit 1005
- 1313 Lincoln St Unit 401
- 1828 Hilyard St
- 344 E 14th Ave
- 2121 Hilyard St
Your Personal Tour Guide
Ask me questions while you tour the home.