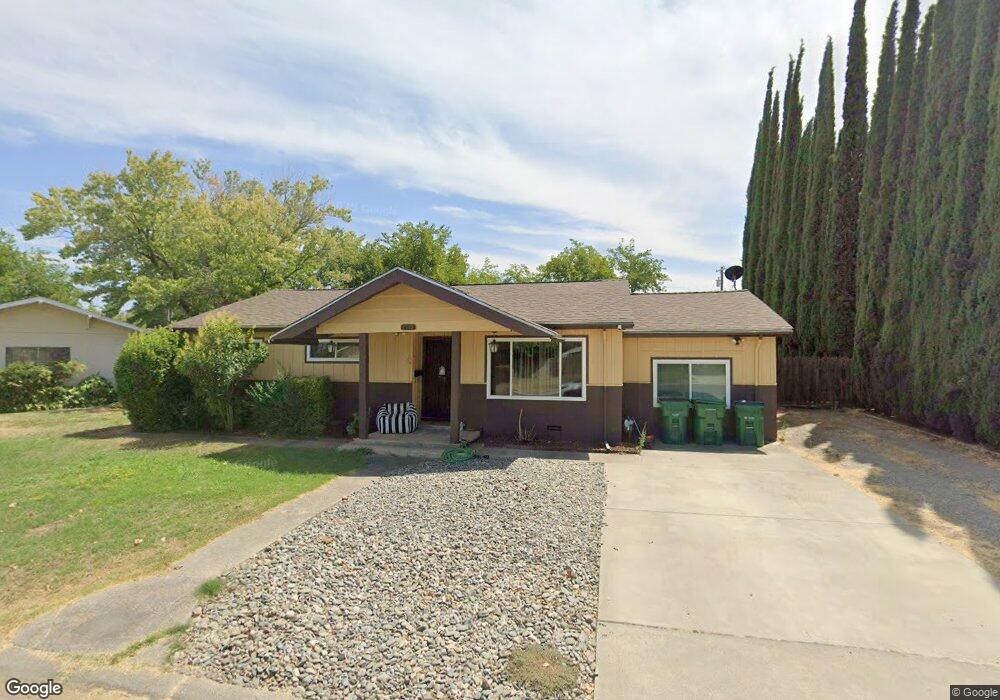
2119 Colusa St Corning, CA 96021
Estimated Value: $335,037 - $381,000
3
Beds
1
Bath
2,024
Sq Ft
$177/Sq Ft
Est. Value
About This Home
This home is located at 2119 Colusa St, Corning, CA 96021 and is currently estimated at $358,759, approximately $177 per square foot. 2119 Colusa St is a home located in Tehama County with nearby schools including Woodson Elementary School, Maywood Middle School, and Corning High School.
Ownership History
Date
Name
Owned For
Owner Type
Purchase Details
Closed on
Jan 27, 2022
Sold by
Standridge Georgia M
Bought by
Garnica Richard D
Current Estimated Value
Home Financials for this Owner
Home Financials are based on the most recent Mortgage that was taken out on this home.
Original Mortgage
$315,000
Outstanding Balance
$291,311
Interest Rate
3.22%
Mortgage Type
FHA
Estimated Equity
$67,448
Create a Home Valuation Report for This Property
The Home Valuation Report is an in-depth analysis detailing your home's value as well as a comparison with similar homes in the area
Purchase History
| Date | Buyer | Sale Price | Title Company |
|---|---|---|---|
| Garnica Richard D | $350,000 | Northern California Title |
Source: Public Records
Mortgage History
| Date | Status | Borrower | Loan Amount |
|---|---|---|---|
| Open | Garnica Richard D | $315,000 |
Source: Public Records
Tax History
| Year | Tax Paid | Tax Assessment Tax Assessment Total Assessment is a certain percentage of the fair market value that is determined by local assessors to be the total taxable value of land and additions on the property. | Land | Improvement |
|---|---|---|---|---|
| 2025 | $3,826 | $371,422 | $63,672 | $307,750 |
| 2023 | $3,753 | $357,000 | $61,200 | $295,800 |
| 2022 | $383 | $42,622 | $6,889 | $35,733 |
| 2021 | $368 | $41,787 | $6,754 | $35,033 |
| 2020 | $371 | $41,359 | $6,685 | $34,674 |
| 2019 | $354 | $40,549 | $6,554 | $33,995 |
| 2018 | $354 | $39,755 | $6,426 | $33,329 |
| 2017 | $350 | $38,976 | $6,300 | $32,676 |
| 2016 | $325 | $38,213 | $6,177 | $32,036 |
| 2015 | $322 | $37,640 | $6,085 | $31,555 |
| 2014 | $315 | $36,903 | $5,966 | $30,937 |
Source: Public Records
Map
Nearby Homes
- 233 Rio Verde Ct
- 243 Edith Ave
- 1890 North St
- 1001 Toomes Ave
- 611 Hoag St
- 611 Hoag St Unit 250
- 1517 Tehama St
- 2018 Donnovan Ave
- 2173 Donnovan Ave
- 1075 99w
- 4779 Houghton Ave
- 0 Carona Ave
- 1547 Blackburn Ave
- 2067 Blossom Ave
- 0 Toomes Ave Unit SN25272183
- 0 Toomes Ave Unit SN24222817
- 0 Toomes Ave Unit SN25176211
- 311 6th St
- 4909 Edith Ave
- 409 4th St
- 2129 Colusa Cir
- 2107 Colusa St
- 2141 Colusa Cir
- 2093 Colusa St
- 2120 Colusa St
- 2108 Colusa St
- 2128 Colusa St
- 2086 Dolla Ct
- 2094 Colusa St
- 2096 Dolla Ct
- 2083 Colusa St
- 2157 Colusa St
- 2148 Colusa St
- 2155 Colusa Cir
- 2082 Colusa St
- 2076 Dolla Ct
- 423 Rio Grande Ct
- 403 Rio Grande Ct
- 422 Rio Vista Ct
- 2158 Colusa St
Your Personal Tour Guide
Ask me questions while you tour the home.