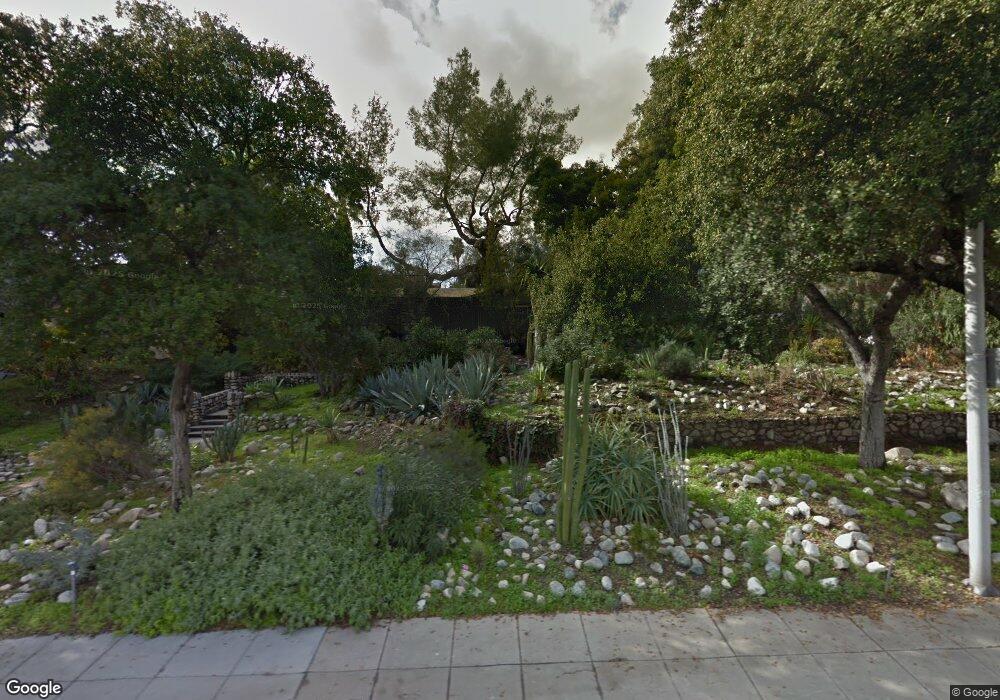
2121 Canada Blvd Glendale, CA 91208
Verdugo Woodlands NeighborhoodEstimated Value: $1,745,484 - $1,957,000
4
Beds
2
Baths
2,399
Sq Ft
$771/Sq Ft
Est. Value
About This Home
This home is located at 2121 Canada Blvd, Glendale, CA 91208 and is currently estimated at $1,849,121, approximately $770 per square foot. 2121 Canada Blvd is a home located in Los Angeles County with nearby schools including Verdugo Woodlands Elementary School, Woodrow Wilson Middle School, and Glendale High School.
Ownership History
Date
Name
Owned For
Owner Type
Purchase Details
Closed on
Feb 3, 2022
Sold by
Robbins Peter K
Bought by
Robbins Peter and Robbins Kluane
Current Estimated Value
Home Financials for this Owner
Home Financials are based on the most recent Mortgage that was taken out on this home.
Original Mortgage
$987,789
Outstanding Balance
$910,328
Interest Rate
3.56%
Mortgage Type
FHA
Estimated Equity
$938,793
Purchase Details
Closed on
Oct 19, 1993
Sold by
Fleming Harriet G
Bought by
Robbins Peter K
Purchase Details
Closed on
Aug 10, 1993
Sold by
Norley Wallace D and The Wallace D Norley Living Tr
Bought by
Robbins Peter K
Home Financials for this Owner
Home Financials are based on the most recent Mortgage that was taken out on this home.
Original Mortgage
$273,750
Interest Rate
6.81%
Create a Home Valuation Report for This Property
The Home Valuation Report is an in-depth analysis detailing your home's value as well as a comparison with similar homes in the area
Home Values in the Area
Average Home Value in this Area
Purchase History
| Date | Buyer | Sale Price | Title Company |
|---|---|---|---|
| Robbins Peter | -- | New Title Company Name | |
| Robbins Peter K | -- | Guardian Title Company | |
| Robbins Peter K | $365,000 | Guardian Title Company |
Source: Public Records
Mortgage History
| Date | Status | Borrower | Loan Amount |
|---|---|---|---|
| Open | Robbins Peter | $987,789 | |
| Previous Owner | Robbins Peter K | $273,750 |
Source: Public Records
Tax History
| Year | Tax Paid | Tax Assessment Tax Assessment Total Assessment is a certain percentage of the fair market value that is determined by local assessors to be the total taxable value of land and additions on the property. | Land | Improvement |
|---|---|---|---|---|
| 2025 | $6,843 | $620,358 | $496,299 | $124,059 |
| 2024 | $6,843 | $608,195 | $486,568 | $121,627 |
| 2023 | $6,689 | $596,271 | $477,028 | $119,243 |
| 2022 | $6,571 | $584,580 | $467,675 | $116,905 |
| 2021 | $6,450 | $573,118 | $458,505 | $114,613 |
| 2019 | $6,204 | $556,120 | $444,906 | $111,214 |
| 2018 | $6,082 | $545,217 | $436,183 | $109,034 |
| 2016 | $5,787 | $524,048 | $419,247 | $104,801 |
| 2015 | $5,670 | $516,177 | $412,950 | $103,227 |
| 2014 | $5,628 | $506,066 | $404,861 | $101,205 |
Source: Public Records
Map
Nearby Homes
- 1898 Bonita Dr
- 1765 Fern Ln
- 1823 Hillside Dr
- 1855 Verdugo Knolls Dr
- 1 Pasa Glen Dr
- 2460 Las Positas Rd
- 182 Emburns Dr
- 192 Emburns Dr
- 2 Emburns Dr
- 1659 Puebla Dr
- 1801 Verdugo Loma Dr
- 1724 Sombra Dr
- 2420 Delisle Ct
- 2940 N Verdugo Rd Unit 214
- 1535 Royal Blvd
- 2950 Oak Glen Rd
- 1881 Alpha Rd Unit 17
- 0 Vista Del Verde Dr Unit JT26048198
- 2 Vista Del Verde Dr
- 6 Vista Del Verde Dr
- 2115 Canada Blvd
- 1644 Camulos Ave
- 2201 Canada Blvd
- 1640 Camulos Ave
- 2101 Canada Blvd
- 2207 Canada Blvd
- 1636 Camulos Ave
- 1645 Camulos Ave
- 1643 Wabasso Way
- 1641 Camulos Ave
- 2124 Canada Blvd
- 2118 Canada Blvd
- 2114 Canada Blvd
- 1630 Camulos Ave
- 2213 Canada Blvd
- 1635 Camulos Ave
- 2200 Canada Blvd
- 1635 Wabasso Way
- 2110 Canada Blvd
- 2206 Canada Blvd
Your Personal Tour Guide
Ask me questions while you tour the home.