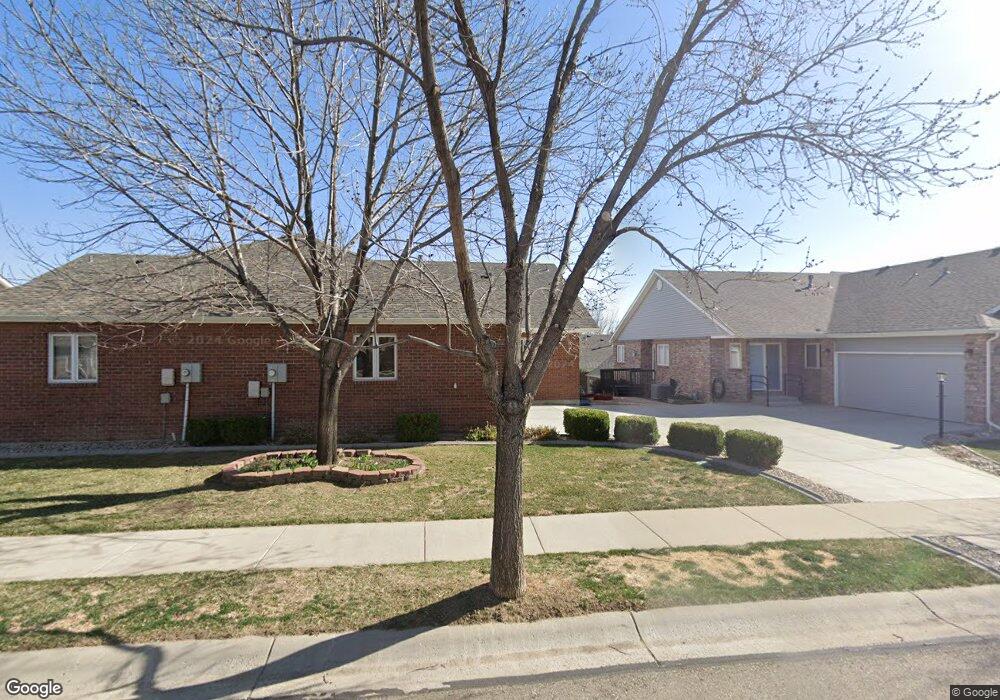
2121 Sherwood Forest Ct Fort Collins, CO 80524
Estimated Value: $436,000 - $518,000
4
Beds
3
Baths
1,280
Sq Ft
$371/Sq Ft
Est. Value
About This Home
This home is located at 2121 Sherwood Forest Ct, Fort Collins, CO 80524 and is currently estimated at $475,443, approximately $371 per square foot. 2121 Sherwood Forest Ct is a home located in Larimer County with nearby schools including Tavelli Elementary School, Lincoln Middle School, and Poudre High School.
Ownership History
Date
Name
Owned For
Owner Type
Purchase Details
Closed on
Sep 8, 2005
Sold by
Hayes Robert E
Bought by
Hayes Robert E and Hayes Michelle L
Current Estimated Value
Purchase Details
Closed on
Jun 25, 2002
Sold by
Nebarado Construction Inc
Bought by
Hayes Robert E
Home Financials for this Owner
Home Financials are based on the most recent Mortgage that was taken out on this home.
Original Mortgage
$162,843
Outstanding Balance
$66,775
Interest Rate
6.25%
Estimated Equity
$408,668
Purchase Details
Closed on
Sep 17, 2001
Sold by
R E L M Of Fort Collins Llc
Bought by
Nebarado Construction Inc
Home Financials for this Owner
Home Financials are based on the most recent Mortgage that was taken out on this home.
Original Mortgage
$182,308
Interest Rate
6.96%
Mortgage Type
Construction
Create a Home Valuation Report for This Property
The Home Valuation Report is an in-depth analysis detailing your home's value as well as a comparison with similar homes in the area
Home Values in the Area
Average Home Value in this Area
Purchase History
| Date | Buyer | Sale Price | Title Company |
|---|---|---|---|
| Hayes Robert E | -- | Security Title | |
| Hayes Robert E | $200,300 | Transnation Title Inc Co | |
| Nebarado Construction Inc | -- | -- |
Source: Public Records
Mortgage History
| Date | Status | Borrower | Loan Amount |
|---|---|---|---|
| Open | Hayes Robert E | $162,843 | |
| Previous Owner | Nebarado Construction Inc | $182,308 |
Source: Public Records
Tax History Compared to Growth
Tax History
| Year | Tax Paid | Tax Assessment Tax Assessment Total Assessment is a certain percentage of the fair market value that is determined by local assessors to be the total taxable value of land and additions on the property. | Land | Improvement |
|---|---|---|---|---|
| 2025 | $2,051 | $31,764 | $8,167 | $23,597 |
| 2024 | $1,952 | $31,764 | $8,167 | $23,597 |
| 2022 | $1,722 | $25,187 | $3,336 | $21,851 |
| 2021 | $1,740 | $25,912 | $3,432 | $22,480 |
| 2020 | $1,670 | $24,996 | $3,432 | $21,564 |
| 2019 | $1,677 | $24,996 | $3,432 | $21,564 |
| 2018 | $1,319 | $21,672 | $3,456 | $18,216 |
| 2017 | $1,968 | $21,672 | $3,456 | $18,216 |
| 2016 | $1,772 | $19,415 | $3,821 | $15,594 |
| 2015 | $1,760 | $19,410 | $3,820 | $15,590 |
| 2014 | $1,394 | $15,280 | $2,870 | $12,410 |
Source: Public Records
Map
Nearby Homes
- 2150 Sherwood Forest Ct
- 2126 Friar Tuck Ct
- 2221 Chesapeake Dr
- 1604 Heber Dr
- 2327 Sunbury Ln
- 1545 Adriel Ct Unit 1545
- 1508 Linden Lake Rd
- 2305 Turnberry Rd
- 1311 S View Cir
- 2332 Marshfield Ln
- 1643 Adriel Dr Unit 1643
- 1614 Hillside Dr
- 2427 Maple Hill Dr
- 2513 Banbury Ln
- 2463 Clarion Ln
- 2468 Ashland Ln
- 2237 Woodbury Ln
- 1412 Wimbledon Ct
- 2220 Woodbury Ln
- 2503 Thoreau Dr
- 2115 Sherwood Forest Ct
- 2115 Sherwood Forest Ct
- 2127 Sherwood Forest Ct
- 2109 Sherwood Ct
- 2109 Sherwood Forest Ct
- 2109 Sherwood Forest Ct
- 2133 Sherwood Forest Ct
- 2126 Chesapeake Dr
- 2126 Chesapeake Dr
- 2120 Chesapeake Dr
- 2132 Chesapeake Dr
- 2132 Chesapeake Dr
- 2114 Chesapeake Dr
- 2139 Sherwood Forest Ct
- 2138 Chesapeake Dr
- 2138 Chesapeake Dr
- 2120 Sherwood Forest Ct
- 2120 Sherwood Forest Ct
- 2103 Sherwood Forest Ct
- 2103 Sherwood Forest Ct