


SOLD AUG 3, 2023
RENTED FEB 1, 2025
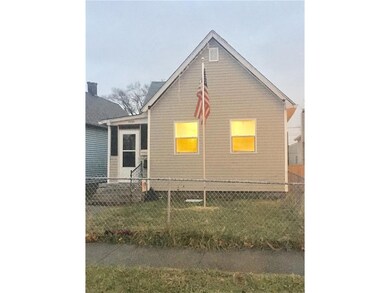
2121 Webb St Indianapolis, IN 46225
Old Southside Neighborhood
2
Beds
1
Bath
1,128
Sq Ft
3,615
Sq Ft Lot
Highlights
- Traditional Architecture
- Covered patio or porch
- 1-Story Property
- No HOA
- 1 Car Detached Garage
- Combination Kitchen and Dining Room
About This Home
As of September 2024This home is located at 2121 Webb St, Indianapolis, IN 46225 and is currently priced at $60,000, approximately $53 per square foot. This property was built in 1890. 2121 Webb St is a home located in Marion County with nearby schools including James A. Garfield School 31, Arsenal Technical High School, and George Washington Community High School (9-12).
Last Agent to Sell the Property
Stephanie Rainbolt
Dropped Members License #RB20001138 Listed on: 04/03/2023
Last Buyer's Agent
Chiquita Watkins
Compass Indiana, LLC
Home Details
Home Type
- Single Family
Est. Annual Taxes
- $272
Year Built
- Built in 1890
Parking
- 1 Car Detached Garage
Home Design
- Traditional Architecture
- Block Foundation
- Vinyl Siding
Interior Spaces
- 1-Story Property
- Combination Kitchen and Dining Room
- Basement
- Basement Cellar
- Attic Access Panel
Flooring
- Carpet
- Laminate
- Vinyl
Bedrooms and Bathrooms
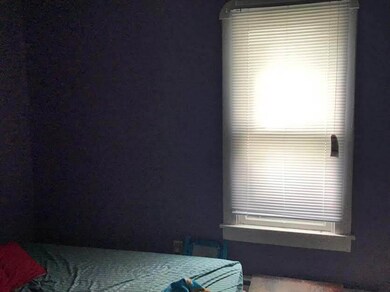
- 2 Bedrooms
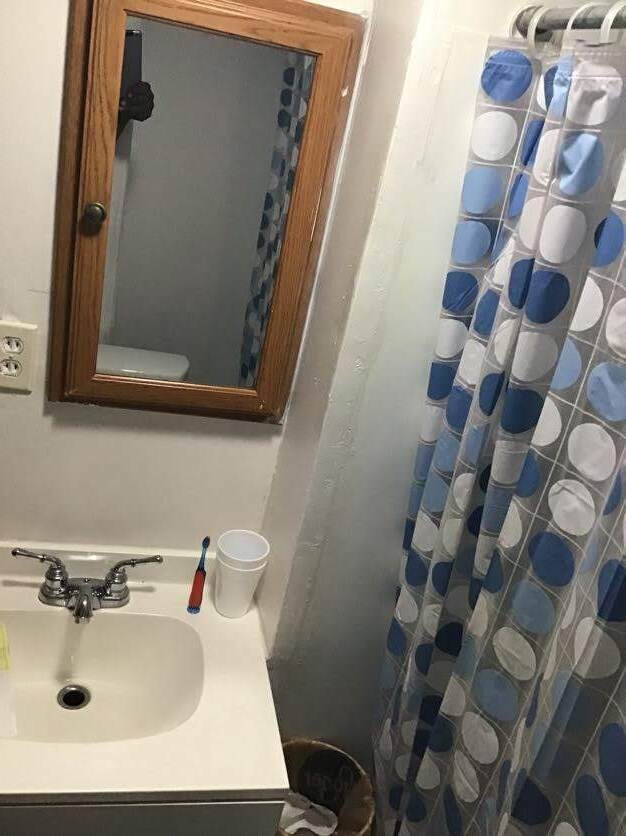
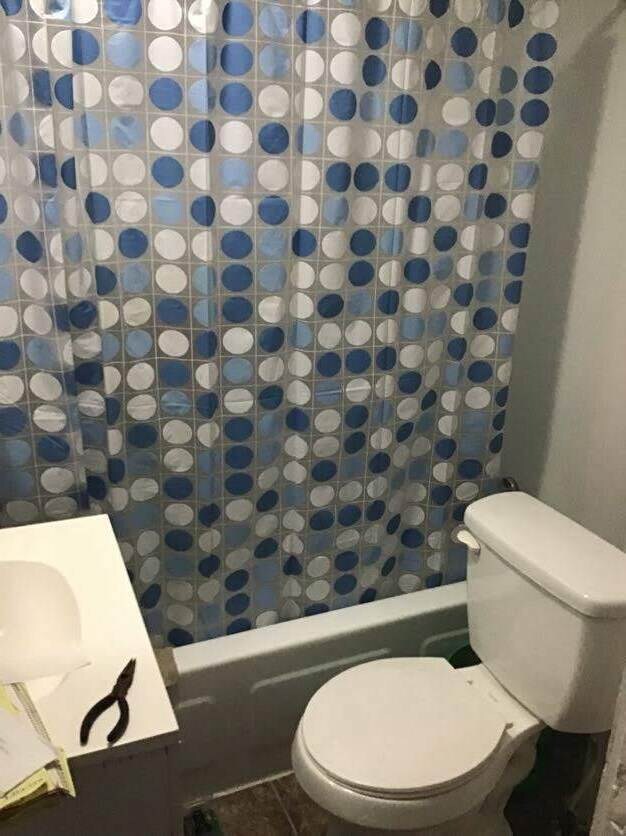
- 1 Full Bathroom
Utilities
- Cooling System Mounted In Outer Wall Opening
- Baseboard Heating
- Heating System Uses Gas
- Gas Water Heater
Additional Features
- Covered patio or porch
- 3,615 Sq Ft Lot
Community Details
- No Home Owners Association
- Schroluckes Madison Ave Subdivision
Listing and Financial Details
- Tax Lot 19
- Assessor Parcel Number 491113148020000101
Ownership History
Date
Name
Owned For
Owner Type
Purchase Details
Listed on
Aug 12, 2024
Closed on
Sep 30, 2024
Sold by
Megabrick Llc
Bought by
9839 Maurine Llc
Seller's Agent
Chiquita Watkins
Ever Real Estate, LLC
Buyer's Agent
Chiquita Watkins
Ever Real Estate, LLC
List Price
$190,000
Sold Price
$190,000
Views
40
Current Estimated Value
Home Financials for this Owner
Home Financials are based on the most recent Mortgage that was taken out on this home.
Estimated Appreciation
-$2,485
Avg. Annual Appreciation
-3.34%
Purchase Details
Listed on
Apr 3, 2023
Closed on
Jul 31, 2023
Sold by
King Leslie Rae
Bought by
Megabrick Llc
Seller's Agent
Stephanie Rainbolt
Dropped Members
Buyer's Agent
Chiquita Watkins
Compass Indiana, LLC
List Price
$65,000
Sold Price
$60,000
Premium/Discount to List
-$5,000
-7.69%
Views
129
Home Financials for this Owner
Home Financials are based on the most recent Mortgage that was taken out on this home.
Avg. Annual Appreciation
170.12%
Original Mortgage
$133,000
Outstanding Balance
$130,547
Interest Rate
6.67%
Mortgage Type
New Conventional
Estimated Equity
$54,359
Purchase Details
Closed on
Dec 7, 2018
Sold by
J & K Freedom Fund Llc
Bought by
King Leslie Rae
Home Financials for this Owner
Home Financials are based on the most recent Mortgage that was taken out on this home.
Original Mortgage
$38,300
Interest Rate
4.9%
Mortgage Type
New Conventional
Purchase Details
Closed on
Feb 23, 2018
Purchase Details
Closed on
Feb 20, 2013
Sold by
Branham Francis Paul
Bought by
Mcclure Jennifer and Mcclure Duwayne
Purchase Details
Closed on
Feb 15, 2013
Sold by
Branham Sharon S and Branham Francis P
Bought by
Mcclure Jennifer and Mcclure Duwayne
Purchase Details
Closed on
Oct 29, 2008
Sold by
Davis Mary P
Bought by
Branham Francis Paul and Branham Sharon Sue
Similar Homes in Indianapolis, IN
Create a Home Valuation Report for This Property
The Home Valuation Report is an in-depth analysis detailing your home's value as well as a comparison with similar homes in the area
Home Values in the Area
Average Home Value in this Area
Purchase History
| Date | Type | Sale Price | Title Company |
|---|---|---|---|
| Contract Of Sale | $190,000 | -- | |
| Warranty Deed | $60,000 | Near North Title Group | |
| Warranty Deed | $47,875 | Monument Title Insurance Compa | |
| Deed | $29,000 | -- | |
| Warranty Deed | $29,000 | Monument Title Insurance Compa | |
| Deed | $29,000 | Monument Title Insurance Compa | |
| Deed | $5,000 | -- | |
| Warranty Deed | -- | -- | |
| Warranty Deed | -- | None Available |
Source: Public Records
Mortgage History
| Date | Status | Loan Amount | Loan Type |
|---|---|---|---|
| Open | $133,000 | New Conventional | |
| Previous Owner | $38,300 | New Conventional |
Source: Public Records
Property History
| Date | Event | Price | Change | Sq Ft Price |
|---|---|---|---|---|
| 02/01/2025 02/01/25 | Rented | $1,675 | 0.0% | -- |
| 01/18/2025 01/18/25 | Under Contract | -- | -- | -- |
| 01/04/2025 01/04/25 | For Rent | $1,675 | 0.0% | -- |
| 12/31/2024 12/31/24 | Off Market | $1,675 | -- | -- |
| 12/16/2024 12/16/24 | For Rent | $1,675 | 0.0% | -- |
| 09/30/2024 09/30/24 | Sold | $190,000 | 0.0% | $226 / Sq Ft |
| 09/12/2024 09/12/24 | Pending | -- | -- | -- |
| 08/12/2024 08/12/24 | For Sale | $190,000 | +216.7% | $226 / Sq Ft |
| 08/03/2023 08/03/23 | Sold | $60,000 | -7.7% | $53 / Sq Ft |
| 07/09/2023 07/09/23 | Pending | -- | -- | -- |
| 06/09/2023 06/09/23 | For Sale | $65,000 | 0.0% | $58 / Sq Ft |
| 05/25/2023 05/25/23 | Pending | -- | -- | -- |
| 05/23/2023 05/23/23 | Price Changed | $65,000 | -13.3% | $58 / Sq Ft |
| 05/12/2023 05/12/23 | For Sale | $75,000 | 0.0% | $66 / Sq Ft |
| 04/11/2023 04/11/23 | Pending | -- | -- | -- |
| 04/03/2023 04/03/23 | For Sale | $75,000 | -- | $66 / Sq Ft |
Source: MIBOR Broker Listing Cooperative®
Tax History Compared to Growth
Tax History
| Year | Tax Paid | Tax Assessment Tax Assessment Total Assessment is a certain percentage of the fair market value that is determined by local assessors to be the total taxable value of land and additions on the property. | Land | Improvement |
|---|---|---|---|---|
| 2024 | $2,311 | $99,000 | $5,000 | $94,000 |
| 2023 | $2,311 | $94,500 | $5,000 | $89,500 |
| 2022 | $2,169 | $89,000 | $5,000 | $84,000 |
| 2021 | $1,945 | $81,400 | $5,000 | $76,400 |
| 2020 | $1,807 | $75,200 | $5,000 | $70,200 |
| 2019 | $1,365 | $55,100 | $5,900 | $49,200 |
| 2018 | $448 | $48,900 | $5,900 | $43,000 |
| 2017 | $350 | $41,600 | $5,900 | $35,700 |
| 2016 | $333 | $41,600 | $5,900 | $35,700 |
| 2014 | $271 | $37,100 | $5,900 | $31,200 |
| 2013 | $823 | $36,300 | $5,900 | $30,400 |
Source: Public Records
Agents Affiliated with this Home
-
Evona Watson
Seller's Agent in 2025
Evona Watson
Triple E Realty, LLC
(317) 281-9280
131 Total Sales
-
Nathan Schroth
Seller Co-Listing Agent in 2025
Nathan Schroth
Triple E Realty, LLC
(317) 500-4759
2 Total Sales
-
Chiquita Watkins
Seller's Agent in 2024
Chiquita Watkins
Ever Real Estate, LLC
(317) 512-0348
2 in this area
323 Total Sales
-
S
Seller's Agent in 2023
Stephanie Rainbolt
Dropped Members
-
April Fitzgerald
Seller Co-Listing Agent in 2023
April Fitzgerald
Richfield Realty Group
(317) 201-1548
1 in this area
93 Total Sales
Map
Source: MIBOR Broker Listing Cooperative®
MLS Number: 21909048
APN: 49-11-13-148-020.000-101
Disclaimer: Certain information contained herein is derived from information provided by parties other than Homes.com. All information provided is deemed reliable, but is not guaranteed to be accurate and should be independently verified.
![]() Based on information submitted to the MLS GRID. All data is obtained from various sources and may not have been verified by broker or MLS GRID. Supplied Open House Information is subject to change without notice. All information should be independently reviewed and verified for accuracy. Properties may or may not be listed by the office/agent presenting the information. Some IDX listings have been excluded from this website.
Based on information submitted to the MLS GRID. All data is obtained from various sources and may not have been verified by broker or MLS GRID. Supplied Open House Information is subject to change without notice. All information should be independently reviewed and verified for accuracy. Properties may or may not be listed by the office/agent presenting the information. Some IDX listings have been excluded from this website.
Nearby Homes
- 2161 Ransdell St
- 1915 Madison Ave
- 2215 S Delaware St
- 2170 S East St
- 2035 S Pennsylvania St
- 2148 Singleton St
- 55 E Regent St
- Parcel 2-2217 Union St
- 408 E Beecher St
- 243 E Caven St
- 1919 S Talbott St
- 2217 Union St
- 2156 Union St
- 19 E Regent St
- 413 E Caven St
- 2245 Union St
- 1921 Union St
- 2157 S Meridian St
- 1801 S Delaware St
- 2165 S Meridian St