21213 Bittersweet Dr Lenexa, KS 66220
Estimated Value: $583,000 - $683,000
5
Beds
4
Baths
3,062
Sq Ft
$206/Sq Ft
Est. Value
About This Home
This home is located at 21213 Bittersweet Dr, Lenexa, KS 66220 and is currently estimated at $630,610, approximately $205 per square foot. 21213 Bittersweet Dr is a home located in Johnson County with nearby schools including Manchester Park Elementary School, Prairie Trail Middle School, and Olathe Northwest High School.
Ownership History
Date
Name
Owned For
Owner Type
Purchase Details
Closed on
Jun 24, 2013
Sold by
Leiker Thomas J
Bought by
Leiker Thomas J and Leiker Lawrence J
Current Estimated Value
Home Financials for this Owner
Home Financials are based on the most recent Mortgage that was taken out on this home.
Original Mortgage
$137,000
Outstanding Balance
$26,147
Interest Rate
2.81%
Mortgage Type
New Conventional
Estimated Equity
$604,463
Purchase Details
Closed on
May 6, 2013
Sold by
Leiker Thomas J
Bought by
Leiker Thomas J
Home Financials for this Owner
Home Financials are based on the most recent Mortgage that was taken out on this home.
Original Mortgage
$137,000
Outstanding Balance
$26,147
Interest Rate
2.81%
Mortgage Type
New Conventional
Estimated Equity
$604,463
Purchase Details
Closed on
Jul 23, 2009
Sold by
Leiker Thomas J and Leiker Mary K
Bought by
Leiker Thomas J
Create a Home Valuation Report for This Property
The Home Valuation Report is an in-depth analysis detailing your home's value as well as a comparison with similar homes in the area
Home Values in the Area
Average Home Value in this Area
Purchase History
| Date | Buyer | Sale Price | Title Company |
|---|---|---|---|
| Leiker Thomas J | -- | Nations Title Agency Of Kans | |
| Leiker Thomas J | -- | None Available | |
| Leiker Thomas J | -- | None Available |
Source: Public Records
Mortgage History
| Date | Status | Borrower | Loan Amount |
|---|---|---|---|
| Open | Leiker Thomas J | $137,000 |
Source: Public Records
Tax History
| Year | Tax Paid | Tax Assessment Tax Assessment Total Assessment is a certain percentage of the fair market value that is determined by local assessors to be the total taxable value of land and additions on the property. | Land | Improvement |
|---|---|---|---|---|
| 2025 | $6,942 | $70,553 | $14,229 | $56,324 |
| 2024 | $6,942 | $56,511 | $10,786 | $45,725 |
| 2023 | $5,823 | $46,495 | $9,805 | $36,690 |
| 2022 | $5,968 | $46,471 | $8,911 | $37,560 |
| 2021 | $4,739 | $34,994 | $8,911 | $26,083 |
| 2020 | $4,846 | $35,454 | $8,911 | $26,543 |
| 2019 | $5,076 | $36,892 | $7,431 | $29,461 |
| 2018 | $5,095 | $36,627 | $7,431 | $29,196 |
| 2017 | $4,892 | $34,396 | $7,431 | $26,965 |
| 2016 | $4,538 | $32,614 | $7,431 | $25,183 |
| 2015 | $4,677 | $33,637 | $7,431 | $26,206 |
| 2013 | -- | $29,290 | $7,431 | $21,859 |
Source: Public Records
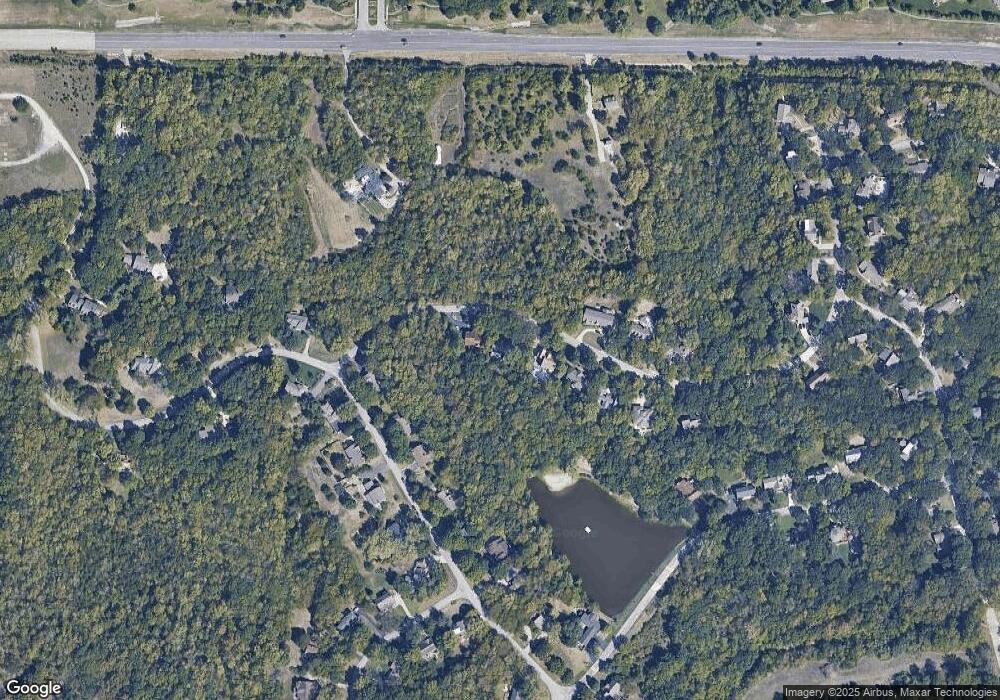
Map
Nearby Homes
- 21206 W 82nd St
- 8005 Millridge St
- 8216 Aurora St
- 8164 Roundtree St
- 8279 Brockway St
- 8211 Aurora St
- 8212 Aurora St
- 8187 Roundtree St
- 8181 Valley Rd
- 21615 W 80th Terrace
- 21922 W 82nd Terrace
- 8013 Millridge St
- 17104 Earnshaw St
- 8001 Millridge St
- 8214 Aurora St
- 8217 Aurora St
- 8209 Aurora St
- 8213 Aurora St
- 8162 Valley Rd
- 8218 Aurora St
- 21209 Bittersweet Dr
- 21301 Bittersweet Dr
- 21205 Bittersweet Dr
- 21204 Bittersweet Dr
- 21201 Bittersweet Dr
- 8413 Bridledale St
- 8417 Bridledale St
- 8417 Bridle Dale St
- 8409 Bridledale St
- 21106 Bittersweet Dr
- 8421 Bridledale St
- 21105 Bittersweet Dr
- 8501 Bridledale St
- 21102 Bittersweet Dr
- 8412 Bridledale St
- 8408 Bridle Dale St
- 8408 Bridledale St
- 21101 Bittersweet Dr
- 8416 Bridledale St
- 8416 Bridle Dale St
Your Personal Tour Guide
Ask me questions while you tour the home.