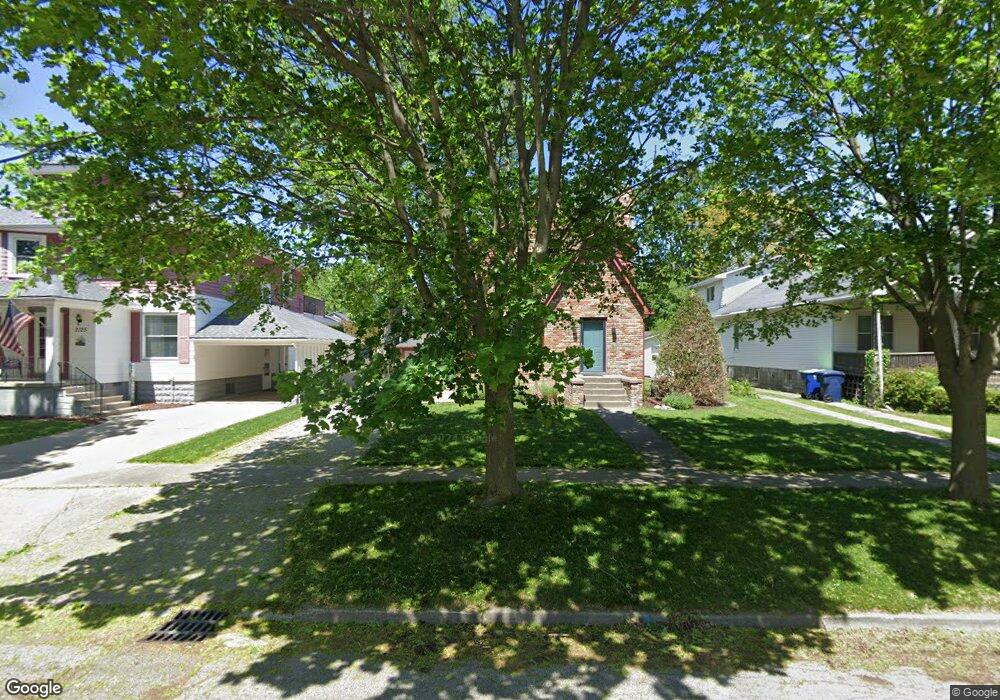
2127 7th St Bay City, MI 48708
Estimated Value: $147,000 - $172,000
3
Beds
1
Bath
1,180
Sq Ft
$134/Sq Ft
Est. Value
About This Home
This home is located at 2127 7th St, Bay City, MI 48708 and is currently estimated at $157,957, approximately $133 per square foot. 2127 7th St is a home located in Bay County with nearby schools including Washington Elementary School, Handy Middle School, and Bay City Central High School.
Ownership History
Date
Name
Owned For
Owner Type
Purchase Details
Closed on
May 15, 2008
Sold by
Sunrise Family Cu
Bought by
Jarosz Jonathan M
Current Estimated Value
Home Financials for this Owner
Home Financials are based on the most recent Mortgage that was taken out on this home.
Original Mortgage
$82,650
Outstanding Balance
$52,479
Interest Rate
5.93%
Mortgage Type
Purchase Money Mortgage
Estimated Equity
$105,478
Purchase Details
Closed on
Feb 16, 1999
Sold by
Gutierrez Karen E
Bought by
Huiskens Kathleen A Stevenson
Create a Home Valuation Report for This Property
The Home Valuation Report is an in-depth analysis detailing your home's value as well as a comparison with similar homes in the area
Home Values in the Area
Average Home Value in this Area
Purchase History
| Date | Buyer | Sale Price | Title Company |
|---|---|---|---|
| Jarosz Jonathan M | $87,000 | None Available | |
| Huiskens Kathleen A Stevenson | $80,000 | -- |
Source: Public Records
Mortgage History
| Date | Status | Borrower | Loan Amount |
|---|---|---|---|
| Open | Jarosz Jonathan M | $82,650 |
Source: Public Records
Tax History Compared to Growth
Tax History
| Year | Tax Paid | Tax Assessment Tax Assessment Total Assessment is a certain percentage of the fair market value that is determined by local assessors to be the total taxable value of land and additions on the property. | Land | Improvement |
|---|---|---|---|---|
| 2025 | $2,398 | $83,000 | $0 | $0 |
| 2024 | $1,974 | $72,900 | $0 | $0 |
| 2023 | $1,879 | $63,650 | $0 | $0 |
| 2022 | $2,158 | $57,150 | $0 | $0 |
| 2021 | $2,030 | $54,050 | $54,050 | $0 |
| 2020 | $2,158 | $52,500 | $52,500 | $0 |
| 2019 | $2,111 | $51,400 | $0 | $0 |
| 2018 | $2,090 | $49,900 | $0 | $0 |
| 2017 | $2,044 | $49,050 | $0 | $0 |
| 2016 | $2,034 | $41,300 | $0 | $41,300 |
| 2015 | $2,014 | $41,300 | $0 | $41,300 |
| 2014 | $2,014 | $41,300 | $0 | $41,300 |
Source: Public Records
Map
Nearby Homes