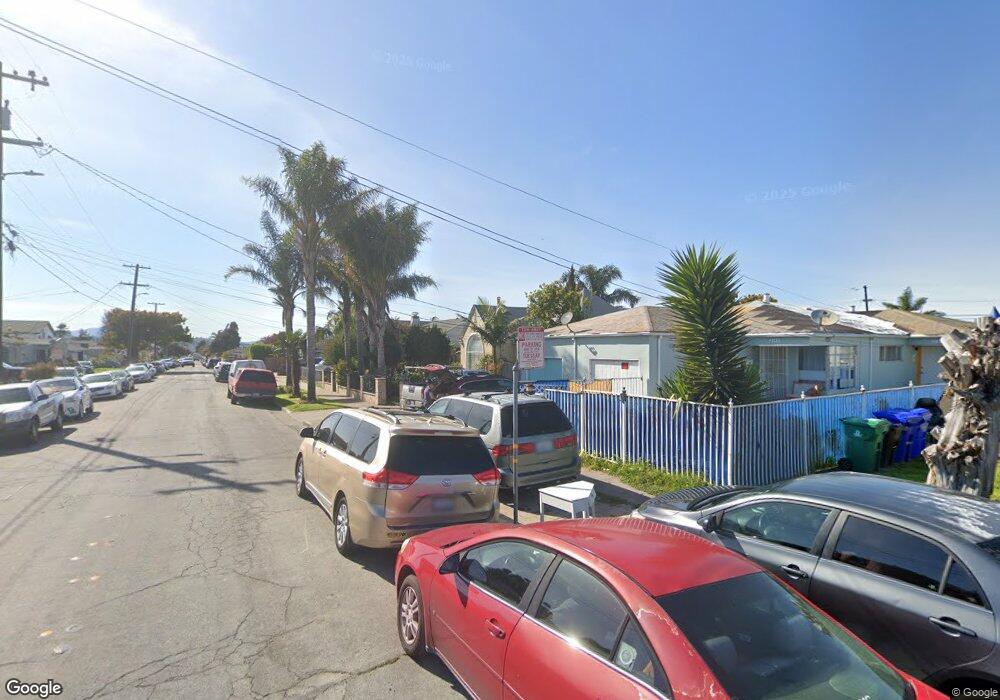
2127 Sanford Ave San Pablo, CA 94806
Estimated Value: $393,000 - $485,000
2
Beds
1
Bath
1,043
Sq Ft
$432/Sq Ft
Est. Value
About This Home
This home is located at 2127 Sanford Ave, San Pablo, CA 94806 and is currently estimated at $450,236, approximately $431 per square foot. 2127 Sanford Ave is a home located in Contra Costa County with nearby schools including Edward M. Downer Elementary School, Walter T. Helms Middle School, and Richmond High School.
Ownership History
Date
Name
Owned For
Owner Type
Purchase Details
Closed on
Dec 9, 2011
Sold by
Soderblom John A and Soderblom David R
Bought by
Redpath Geraldine L and Droutsas John L
Current Estimated Value
Purchase Details
Closed on
Dec 31, 2008
Sold by
U S Bank National Association
Bought by
Soderblom Nelda A
Purchase Details
Closed on
Oct 23, 2008
Sold by
Ruiz Luis E and Ruiz Sandra V
Bought by
U S Bank National Association
Purchase Details
Closed on
Dec 30, 2002
Sold by
Ruiz Luis E and Ruiz Sandra
Bought by
Ruiz Luis E and Ruiz Sandra V
Purchase Details
Closed on
Sep 15, 2000
Sold by
Gerri Shapiro
Bought by
Ruiz Luis E and Ruiz Sandra
Home Financials for this Owner
Home Financials are based on the most recent Mortgage that was taken out on this home.
Original Mortgage
$101,844
Interest Rate
7.98%
Mortgage Type
FHA
Create a Home Valuation Report for This Property
The Home Valuation Report is an in-depth analysis detailing your home's value as well as a comparison with similar homes in the area
Home Values in the Area
Average Home Value in this Area
Purchase History
| Date | Buyer | Sale Price | Title Company |
|---|---|---|---|
| Redpath Geraldine L | $88,000 | Old Republic Title Company | |
| Soderblom Nelda A | $123,000 | Chicago Title Company | |
| U S Bank National Association | $147,652 | None Available | |
| Ruiz Luis E | -- | -- | |
| Ruiz Luis E | $102,000 | Fidelity National Title Co |
Source: Public Records
Mortgage History
| Date | Status | Borrower | Loan Amount |
|---|---|---|---|
| Previous Owner | Ruiz Luis E | $101,844 | |
| Closed | Ruiz Luis E | $5,100 |
Source: Public Records
Tax History Compared to Growth
Tax History
| Year | Tax Paid | Tax Assessment Tax Assessment Total Assessment is a certain percentage of the fair market value that is determined by local assessors to be the total taxable value of land and additions on the property. | Land | Improvement |
|---|---|---|---|---|
| 2025 | $2,618 | $110,519 | $81,637 | $28,882 |
| 2024 | $2,551 | $108,353 | $80,037 | $28,316 |
| 2023 | $2,551 | $106,229 | $78,468 | $27,761 |
| 2022 | $2,498 | $104,147 | $76,930 | $27,217 |
| 2021 | $2,463 | $102,106 | $75,422 | $26,684 |
| 2019 | $2,347 | $99,080 | $73,186 | $25,894 |
| 2018 | $2,240 | $97,138 | $71,751 | $25,387 |
| 2017 | $2,162 | $95,235 | $70,345 | $24,890 |
| 2016 | $2,096 | $93,368 | $68,966 | $24,402 |
| 2015 | $2,055 | $91,967 | $67,931 | $24,036 |
| 2014 | $2,046 | $90,167 | $66,601 | $23,566 |
Source: Public Records
Map
Nearby Homes
- 2143-2147 Sanford Ave
- 0 California Ave
- 1932 California Ave
- 1825 California Ave
- 1902 Dunn Ave
- 1753 California Ave
- 2110 Hellings Ave
- 1337 24th St
- 1921 Coalinga Ave
- 1800 Hellings Ave
- 1741 Hellings Ave
- 2425 Humphrey Ave
- 1527 24th St
- 2376 Bush Ave
- 1616 Pine Ave
- 2420 Bush Ave
- 1929 Lincoln Ave
- 1920 Lincoln Ave
- 1617 17th St
- 2633 Humphrey Ave
- 2121 Sanford Ave
- 2139 Sanford Ave
- 2115 Sanford Ave
- 2143 Sanford Ave Unit 2147
- 2124 Wilcox Ave
- 2111 Sanford Ave
- 2136 Wilcox Ave
- 2120 Wilcox Ave
- 2226 Wilcox Ave
- 2029 Sanford Ave
- 2207 Sanford Ave Unit 2209
- 2134 Sanford Ave
- 2138 Sanford Ave
- 2104 Wilcox Ave
- 2112 Sanford Ave
- 2140 Sanford Ave
- 2232 Wilcox Ave
- 2027 Sanford Ave
- 2227 Sanford Ave
- 2190 Sanford Ave