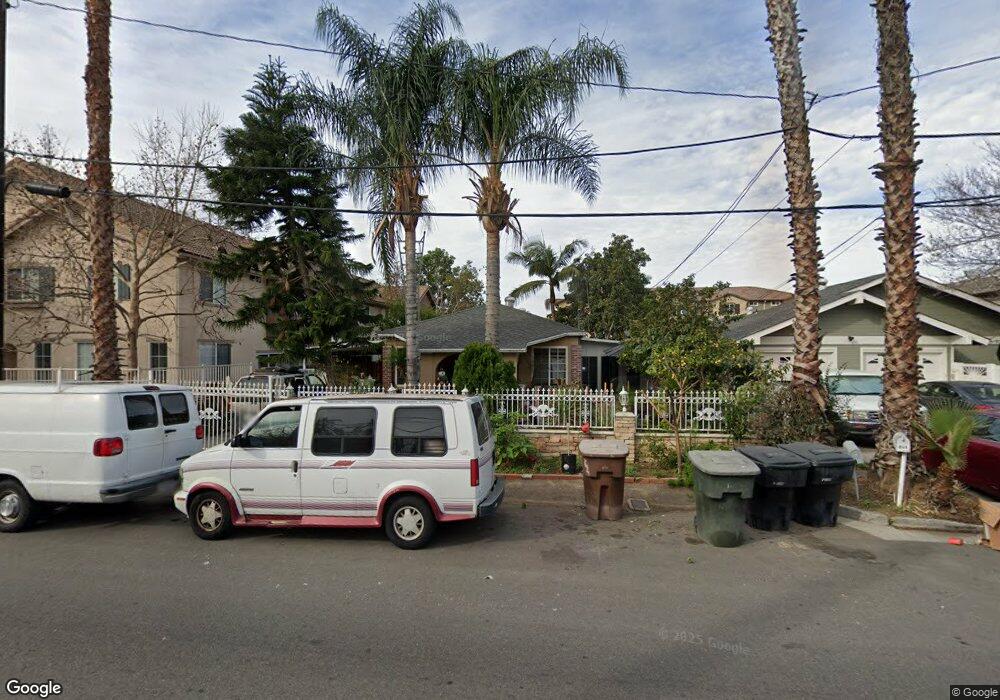
213 S Van Buren St Placentia, CA 92870
Estimated Value: $731,000 - $833,000
1
Bed
1
Bath
1,030
Sq Ft
$750/Sq Ft
Est. Value
About This Home
This home is located at 213 S Van Buren St, Placentia, CA 92870 and is currently estimated at $772,087, approximately $749 per square foot. 213 S Van Buren St is a home located in Orange County with nearby schools including Van Buren Elementary School, Kraemer Middle School, and Valencia High School.
Ownership History
Date
Name
Owned For
Owner Type
Purchase Details
Closed on
Mar 6, 2024
Sold by
Sanchez Antonia and Sanchez Christian Marcos
Bought by
Antonia B Sanchez Revocable Living Trust and Sanchez
Current Estimated Value
Purchase Details
Closed on
Nov 14, 2017
Sold by
Sanchez Antonio
Bought by
Sanchez Antonia and Aquino Sanchez Christian Marcos
Purchase Details
Closed on
Oct 6, 2003
Sold by
Sanchez Antonia Benedicta and Sanchez Gregorio
Bought by
Sanchez Antonia
Home Financials for this Owner
Home Financials are based on the most recent Mortgage that was taken out on this home.
Original Mortgage
$315,000
Interest Rate
5.94%
Mortgage Type
Purchase Money Mortgage
Purchase Details
Closed on
Dec 12, 2001
Sold by
Vargas Jose A and Vargas Irma
Bought by
Sanchez Antonia and Sanchez Gregorio
Home Financials for this Owner
Home Financials are based on the most recent Mortgage that was taken out on this home.
Original Mortgage
$276,739
Interest Rate
7.15%
Mortgage Type
FHA
Purchase Details
Closed on
May 8, 1996
Sold by
Torres Guadalupe R
Bought by
Vargas Jose A and Vargas Irma
Create a Home Valuation Report for This Property
The Home Valuation Report is an in-depth analysis detailing your home's value as well as a comparison with similar homes in the area
Home Values in the Area
Average Home Value in this Area
Purchase History
| Date | Buyer | Sale Price | Title Company |
|---|---|---|---|
| Antonia B Sanchez Revocable Living Trust | -- | None Listed On Document | |
| Sanchez Antonia | -- | None Available | |
| Sanchez Antonia | -- | Fidelity National Title Co | |
| Sanchez Antonia | $287,000 | Lawyers Title Company | |
| Sanchez Gregorio | -- | Lawyers Title Company | |
| Vargas Jose A | -- | -- |
Source: Public Records
Mortgage History
| Date | Status | Borrower | Loan Amount |
|---|---|---|---|
| Previous Owner | Sanchez Antonia | $315,000 | |
| Previous Owner | Sanchez Antonia | $276,739 |
Source: Public Records
Tax History Compared to Growth
Tax History
| Year | Tax Paid | Tax Assessment Tax Assessment Total Assessment is a certain percentage of the fair market value that is determined by local assessors to be the total taxable value of land and additions on the property. | Land | Improvement |
|---|---|---|---|---|
| 2025 | $7,014 | $528,595 | $440,821 | $87,774 |
| 2024 | $7,014 | $518,231 | $432,178 | $86,053 |
| 2023 | $6,831 | $508,070 | $423,704 | $84,366 |
| 2022 | $6,677 | $498,108 | $415,396 | $82,712 |
| 2021 | $6,469 | $488,342 | $407,251 | $81,091 |
| 2020 | $6,489 | $483,335 | $403,075 | $80,260 |
| 2019 | $6,206 | $473,858 | $395,171 | $78,687 |
| 2018 | $6,121 | $464,567 | $387,422 | $77,145 |
| 2017 | $5,937 | $455,458 | $379,825 | $75,633 |
| 2016 | $5,819 | $446,528 | $372,378 | $74,150 |
| 2015 | $5,738 | $439,821 | $366,784 | $73,037 |
| 2014 | $5,584 | $431,206 | $359,599 | $71,607 |
Source: Public Records
Map
Nearby Homes
- 1507 E Spruce St Unit A
- 361 S Van Buren St Unit B
- 1561 Ismail Place
- Plan One Y at Hudson
- Plan Three Y at Hudson
- Plan Three at Hudson
- PLan Three X at Hudson
- Plan One at Hudson
- Plan Two Y at Hudson
- 1553 Lima Way Unit 2
- 1570 Topeka Ave
- 1572 Lima Way Unit 6
- 1563 Lima Way Unit 5
- 1578 Topeka Ave Unit 2
- 1663 Oak St
- 1645 La Paloma Ave
- 1527 Evans Ln
- 1524 Larsen Ln
- 1833 Taft Ln
- 146 Los Alamitos Cir
- 209 S Van Buren St
- 1576 E Spruce St Unit B &C
- 1576 E Spruce St Unit A
- 1576 E Spruce St Unit C
- 1576 E Spruce St Unit B
- 1576 E Spruce St
- 1572 Spruce St
- 231 S Van Buren St
- 1564 E Spruce St
- 1564 E Spruce St
- 1562 E Spruce St
- 1560 E Spruce St
- 1566 E Spruce St
- 1565 E Spruce St Unit B
- 1565 E Spruce St Unit A
- 137 S Van Buren St
- 1565 E Spruce St Unit c
- 1546 Spruce St
- 1565 Spruce St Unit B & C
- 1565 Spruce St Unit B