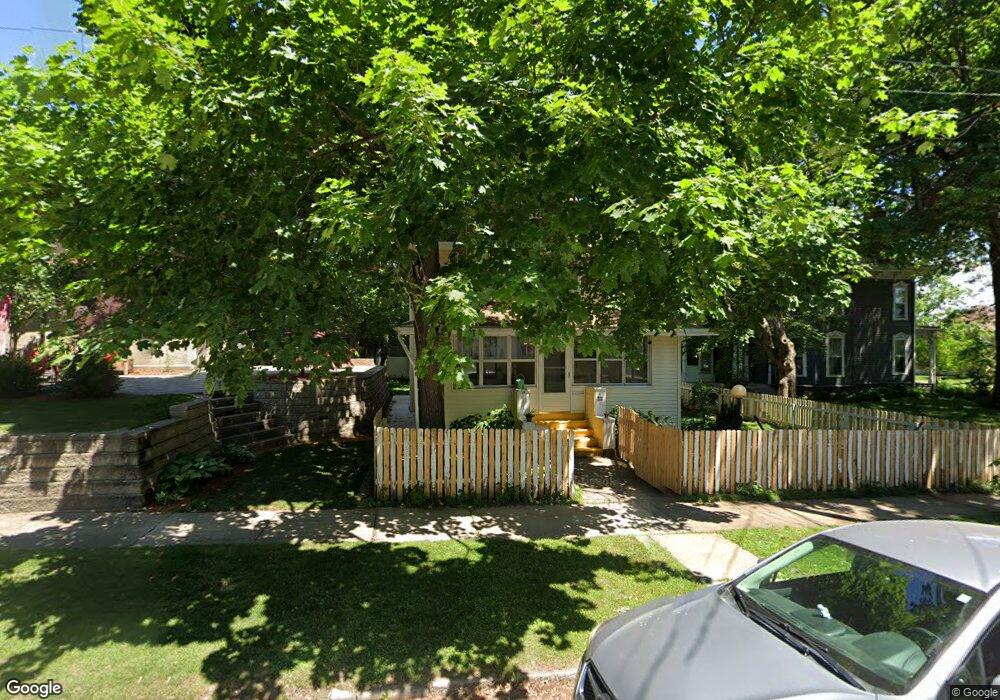
213 W 11th St Cedar Falls, IA 50613
Estimated Value: $173,381 - $215,000
4
Beds
2
Baths
1,656
Sq Ft
$120/Sq Ft
Est. Value
About This Home
This home is located at 213 W 11th St, Cedar Falls, IA 50613 and is currently estimated at $198,595, approximately $119 per square foot. 213 W 11th St is a home located in Black Hawk County with nearby schools including Lincoln Elementary School, Holmes Junior High School, and Cedar Falls High School.
Ownership History
Date
Name
Owned For
Owner Type
Purchase Details
Closed on
Sep 16, 2009
Sold by
Westendorf Kevin A and Westendorf Norma L
Bought by
Griffin Brenna J and Burnett John R
Current Estimated Value
Home Financials for this Owner
Home Financials are based on the most recent Mortgage that was taken out on this home.
Original Mortgage
$127,775
Outstanding Balance
$83,225
Interest Rate
5.19%
Mortgage Type
New Conventional
Estimated Equity
$115,370
Purchase Details
Closed on
Jun 29, 2007
Sold by
Euchner James H
Bought by
Westendorf Kevin A and Westendorf Norma L
Home Financials for this Owner
Home Financials are based on the most recent Mortgage that was taken out on this home.
Original Mortgage
$200,000
Interest Rate
6.42%
Mortgage Type
Credit Line Revolving
Create a Home Valuation Report for This Property
The Home Valuation Report is an in-depth analysis detailing your home's value as well as a comparison with similar homes in the area
Home Values in the Area
Average Home Value in this Area
Purchase History
| Date | Buyer | Sale Price | Title Company |
|---|---|---|---|
| Griffin Brenna J | $134,500 | None Available | |
| Westendorf Kevin A | $132,500 | None Available |
Source: Public Records
Mortgage History
| Date | Status | Borrower | Loan Amount |
|---|---|---|---|
| Open | Griffin Brenna J | $127,775 | |
| Previous Owner | Westendorf Kevin A | $200,000 |
Source: Public Records
Tax History Compared to Growth
Tax History
| Year | Tax Paid | Tax Assessment Tax Assessment Total Assessment is a certain percentage of the fair market value that is determined by local assessors to be the total taxable value of land and additions on the property. | Land | Improvement |
|---|---|---|---|---|
| 2025 | $2,244 | $171,090 | $28,830 | $142,260 |
| 2024 | $2,244 | $149,620 | $19,220 | $130,400 |
| 2023 | $2,246 | $149,620 | $19,220 | $130,400 |
| 2022 | $2,272 | $130,570 | $19,220 | $111,350 |
| 2021 | $2,146 | $130,570 | $19,220 | $111,350 |
| 2020 | $2,100 | $123,840 | $12,490 | $111,350 |
| 2019 | $2,100 | $123,840 | $12,490 | $111,350 |
| 2018 | $2,128 | $123,840 | $12,490 | $111,350 |
| 2017 | $2,178 | $123,840 | $12,490 | $111,350 |
| 2016 | $2,034 | $123,840 | $12,490 | $111,350 |
| 2015 | $2,034 | $123,840 | $12,490 | $111,350 |
| 2014 | $1,884 | $114,160 | $12,490 | $101,670 |
Source: Public Records
Map
Nearby Homes
- 1020 Clay St
- 1017 Washington St
- 1012 Clay St
- 1007 Washington St
- 216 W 11th St
- 216 W 10th St
- 1104 Clay St
- 1107 Washington St
- 1004 Clay St
- 1001 Washington St Unit 1003
- 1110 Clay St
- 1103 Clay St
- 1022 Washington St
- 1016 Washington St
- 1021 Clay St
- 1015 Clay St
- 1117 Washington St
- 120 W 11th St
- 1010 Washington St
- 1003 Clay St