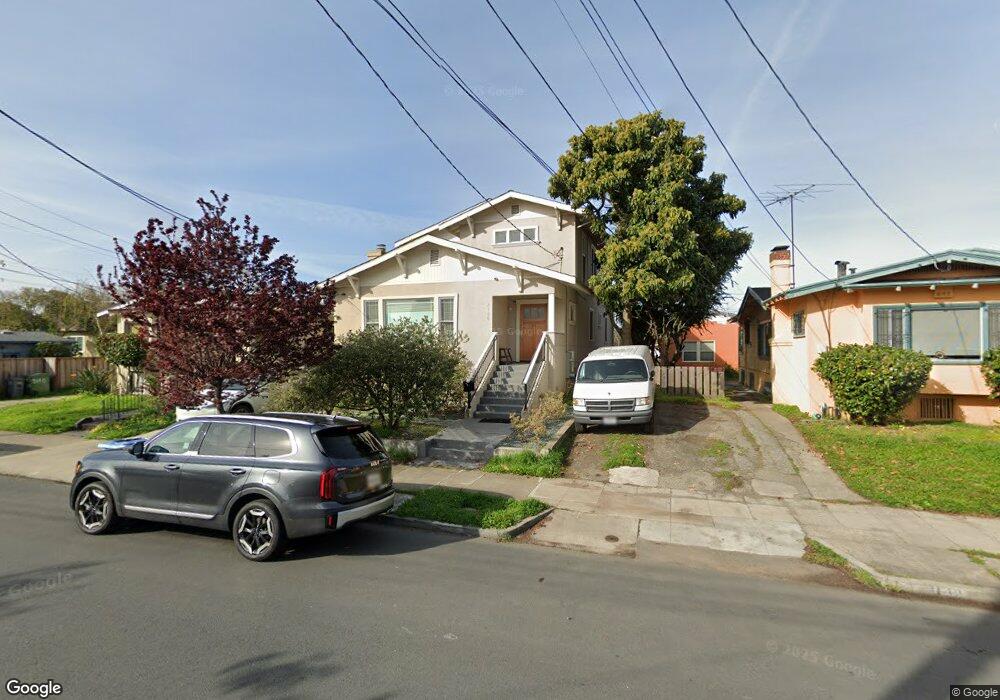
2136 Browning St Berkeley, CA 94702
West Berkeley NeighborhoodEstimated Value: $1,121,000 - $1,807,973
4
Beds
3
Baths
2,560
Sq Ft
$608/Sq Ft
Est. Value
About This Home
This home is located at 2136 Browning St, Berkeley, CA 94702 and is currently estimated at $1,556,243, approximately $607 per square foot. 2136 Browning St is a home located in Alameda County with nearby schools including Rosa Parks Elementary School, Ruth Acty Elementary, and Berkeley Arts Magnet at Whittier School.
Ownership History
Date
Name
Owned For
Owner Type
Purchase Details
Closed on
Sep 21, 2012
Sold by
Ruderman Igor D and Ruderman Igor D
Bought by
Ruderman Igor D
Current Estimated Value
Home Financials for this Owner
Home Financials are based on the most recent Mortgage that was taken out on this home.
Original Mortgage
$405,000
Outstanding Balance
$280,507
Interest Rate
3.59%
Mortgage Type
New Conventional
Estimated Equity
$1,275,736
Purchase Details
Closed on
Jul 18, 2000
Sold by
Ruderman Helen
Bought by
Ruderman Igor D
Purchase Details
Closed on
Dec 11, 1998
Sold by
Simmons Bernard M
Bought by
Ruderman Igor D and Ruderman Helen
Home Financials for this Owner
Home Financials are based on the most recent Mortgage that was taken out on this home.
Original Mortgage
$227,000
Interest Rate
6.86%
Create a Home Valuation Report for This Property
The Home Valuation Report is an in-depth analysis detailing your home's value as well as a comparison with similar homes in the area
Home Values in the Area
Average Home Value in this Area
Purchase History
| Date | Buyer | Sale Price | Title Company |
|---|---|---|---|
| Ruderman Igor D | -- | Lawyers Title | |
| Ruderman Igor D | -- | -- | |
| Ruderman Igor D | $240,000 | Old Republic Title Company |
Source: Public Records
Mortgage History
| Date | Status | Borrower | Loan Amount |
|---|---|---|---|
| Open | Ruderman Igor D | $405,000 | |
| Closed | Ruderman Igor D | $227,000 |
Source: Public Records
Tax History
| Year | Tax Paid | Tax Assessment Tax Assessment Total Assessment is a certain percentage of the fair market value that is determined by local assessors to be the total taxable value of land and additions on the property. | Land | Improvement |
|---|---|---|---|---|
| 2025 | $10,946 | $519,946 | $112,868 | $414,078 |
| 2024 | $10,946 | $509,617 | $110,656 | $405,961 |
| 2023 | $10,688 | $506,489 | $108,486 | $398,003 |
| 2022 | $10,423 | $489,559 | $106,359 | $390,200 |
| 2021 | $10,402 | $479,824 | $104,274 | $382,550 |
| 2020 | $9,643 | $481,834 | $103,205 | $378,629 |
| 2019 | $9,049 | $472,389 | $101,182 | $371,207 |
| 2018 | $8,854 | $463,128 | $99,198 | $363,930 |
| 2017 | $8,532 | $454,050 | $97,254 | $356,796 |
| 2016 | $8,118 | $445,147 | $95,347 | $349,800 |
| 2015 | $7,988 | $438,462 | $93,915 | $344,547 |
| 2014 | $7,878 | $429,874 | $92,075 | $337,799 |
Source: Public Records
Map
Nearby Homes
- 2231 Byron St
- 1230 Addison St
- 2324 Browning St
- 1919 Curtis St
- 2327 10th St Unit 4
- 1039 Channing Way
- 2241 Ninth St
- 1261 Hearst Ave
- 2013 9th St
- 2350 Sacramento St
- 1144 Dwight Way
- 931 Bancroft Way
- 1142 Dwight Way
- 1118 Dwight Way
- 1128 Delaware St
- 1411 Hearst Ave Unit 2
- 1092 Dwight Way
- 1050 Allston Way
- 1728 Curtis St
- 917 Channing Way
- 2140 Browning St
- 1215 Allston Way
- 2135 Curtis St
- 1219 Allston Way
- 1211 Allston Way
- 2131 Curtis St
- 2139 Curtis St
- 1207 Allston Way
- 1203 Allston Way
- 2137 Browning St
- 1225 Allston Way
- 2133 Browning St
- 2141 Browning St
- 2129 Browning St
- 2149 Curtis St
- 2127 Browning St
- 1229 Allston Way
- 2125 Browning St
- 1231 Allston Way
- 2121 Browning St
Your Personal Tour Guide
Ask me questions while you tour the home.