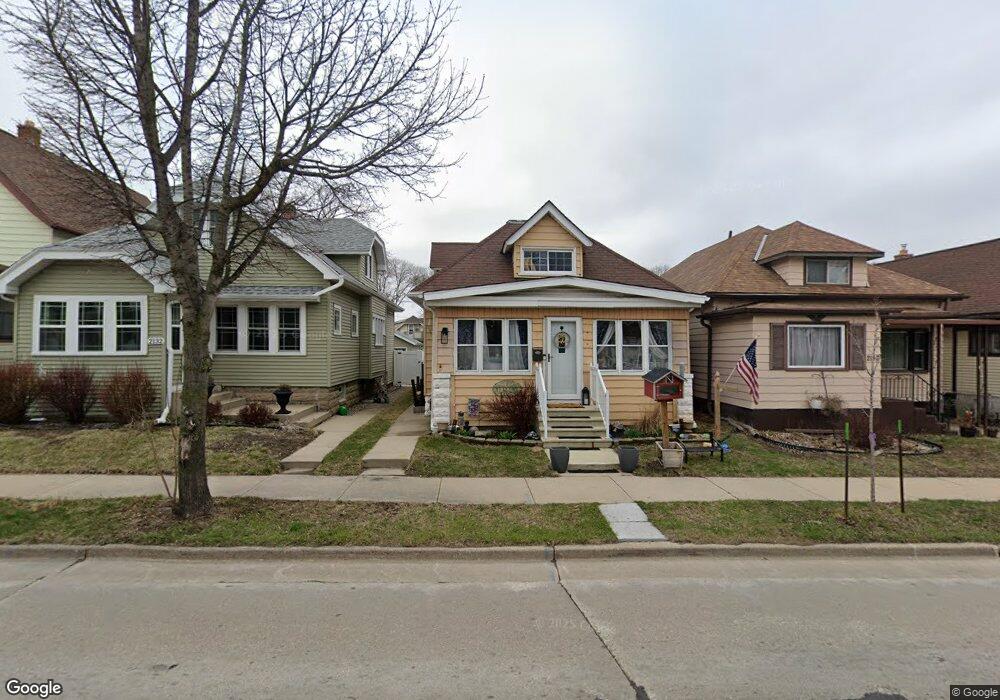
2136 S 76th St Milwaukee, WI 53219
Wood Dale NeighborhoodEstimated Value: $237,244 - $317,000
3
Beds
1
Bath
1,368
Sq Ft
$194/Sq Ft
Est. Value
About This Home
This home is located at 2136 S 76th St, Milwaukee, WI 53219 and is currently estimated at $265,811, approximately $194 per square foot. 2136 S 76th St is a home located in Milwaukee County with nearby schools including Jefferson Elementary School, Frank Lloyd Wright Intermediate School, and Central High School.
Ownership History
Date
Name
Owned For
Owner Type
Purchase Details
Closed on
Aug 30, 2024
Sold by
Skaggs Chad
Bought by
Cork-Skaggs Kelli Cork
Current Estimated Value
Home Financials for this Owner
Home Financials are based on the most recent Mortgage that was taken out on this home.
Original Mortgage
$164,000
Outstanding Balance
$162,245
Interest Rate
6.73%
Mortgage Type
New Conventional
Estimated Equity
$103,566
Purchase Details
Closed on
Jun 15, 2004
Sold by
Huntley Scott S and Huntley Kim Castillo
Bought by
Skaggs Chad and Skaggs Kelli Cork
Home Financials for this Owner
Home Financials are based on the most recent Mortgage that was taken out on this home.
Original Mortgage
$133,500
Interest Rate
8.5%
Purchase Details
Closed on
Jan 14, 2000
Sold by
Nielsen Nels J and Nielsen Judith A
Bought by
Huntley Scott S
Home Financials for this Owner
Home Financials are based on the most recent Mortgage that was taken out on this home.
Original Mortgage
$76,500
Interest Rate
7.84%
Create a Home Valuation Report for This Property
The Home Valuation Report is an in-depth analysis detailing your home's value as well as a comparison with similar homes in the area
Home Values in the Area
Average Home Value in this Area
Purchase History
| Date | Buyer | Sale Price | Title Company |
|---|---|---|---|
| Cork-Skaggs Kelli Cork | -- | None Listed On Document | |
| Skaggs Chad | $133,500 | Priority Title Corporation | |
| Huntley Scott S | $85,000 | -- |
Source: Public Records
Mortgage History
| Date | Status | Borrower | Loan Amount |
|---|---|---|---|
| Open | Cork-Skaggs Kelli Cork | $164,000 | |
| Previous Owner | Skaggs Chad | $133,500 | |
| Previous Owner | Huntley Scott S | $76,500 |
Source: Public Records
Tax History Compared to Growth
Tax History
| Year | Tax Paid | Tax Assessment Tax Assessment Total Assessment is a certain percentage of the fair market value that is determined by local assessors to be the total taxable value of land and additions on the property. | Land | Improvement |
|---|---|---|---|---|
| 2024 | $5,009 | $186,700 | $19,900 | $166,800 |
| 2023 | $4,277 | $113,600 | $12,800 | $100,800 |
| 2022 | $4,044 | $113,600 | $12,800 | $100,800 |
| 2021 | $2,892 | $113,600 | $12,800 | $100,800 |
| 2020 | $3,369 | $113,600 | $12,800 | $100,800 |
| 2019 | $3,811 | $113,600 | $12,800 | $100,800 |
| 2018 | $3,340 | $113,600 | $12,800 | $100,800 |
| 2017 | $4,106 | $113,600 | $12,800 | $100,800 |
| 2016 | $2,915 | $113,600 | $12,800 | $100,800 |
| 2015 | $4,027 | $113,600 | $12,800 | $100,800 |
| 2014 | $3,956 | $113,600 | $12,800 | $100,800 |
Source: Public Records
Map
Nearby Homes
- 2054 S 77th St
- 2033 S 76th St
- 1946 S 76th St
- 2329 S 77th St
- 7924 W Becher St
- 2104 S 71st St
- 2162 S 81st St
- 2352 S 79th St
- 2418 S 77th St
- 2411 S 73rd St
- 2433 S 74th St
- 2226 S 70th St
- 2043 S 81st St
- 2067 S 82nd St
- 7007 W Beloit Rd
- 1632 S 77th St
- 1919 S 69th St
- 1946 S 69th St
- 2449 S 80th St
- 2178 S 84th St
- 2140 S 76th St
- 2132 S 76th St
- 2137 S 76th St
- 2128 S 76th St
- 2144 S 76th St
- 2148 S 76th St
- 2124 S 76th St
- 2152 S 76th St
- 2120 S 76th St
- 2137 S 75th St
- 2129 S 75th St
- 2129 S 75th St Unit 29A
- 2133 S 75th St
- 2145 S 75th St
- 2116 S 76th St
- 2156 S 76th St
- 2149 S 75th St
- 2125 S 75th St
- 2153 S 75th St
- 2160 S 76th St