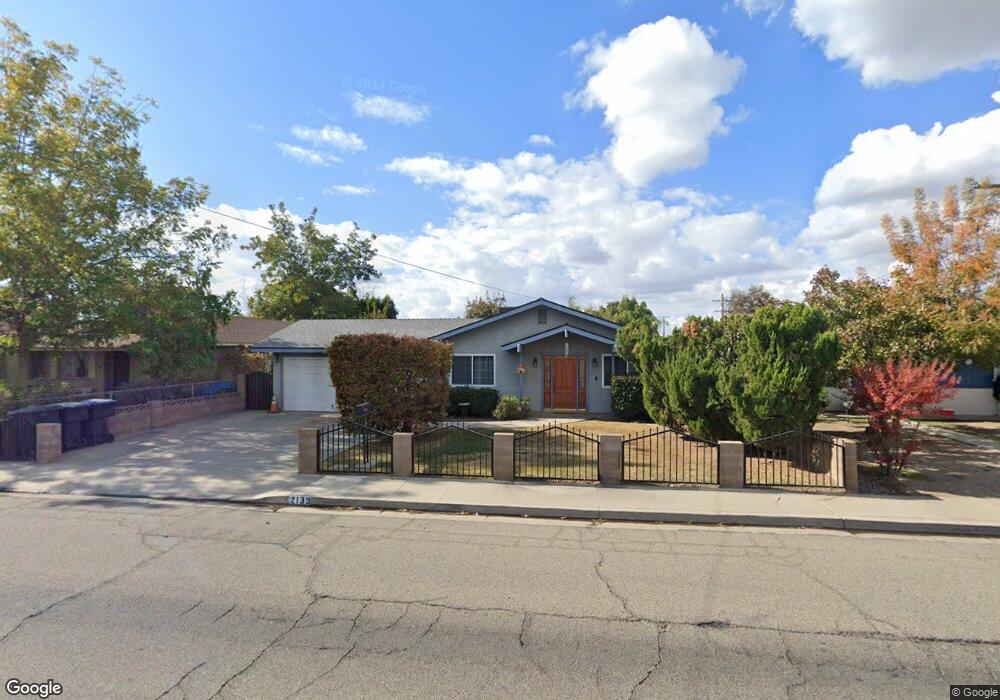
2139 N Bridge St Visalia, CA 93291
North Visalia NeighborhoodEstimated Value: $298,000 - $363,000
4
Beds
3
Baths
1,680
Sq Ft
$197/Sq Ft
Est. Value
About This Home
This home is located at 2139 N Bridge St, Visalia, CA 93291 and is currently estimated at $330,807, approximately $196 per square foot. 2139 N Bridge St is a home located in Tulare County with nearby schools including Crowley Elementary School, Divisadero Middle School, and Mt. Whitney High School.
Ownership History
Date
Name
Owned For
Owner Type
Purchase Details
Closed on
Sep 14, 2007
Sold by
Torres Ramiro
Bought by
Morfin Anthony G and Morfin Vivian M
Current Estimated Value
Home Financials for this Owner
Home Financials are based on the most recent Mortgage that was taken out on this home.
Original Mortgage
$70,000
Interest Rate
6.29%
Mortgage Type
Purchase Money Mortgage
Create a Home Valuation Report for This Property
The Home Valuation Report is an in-depth analysis detailing your home's value as well as a comparison with similar homes in the area
Home Values in the Area
Average Home Value in this Area
Purchase History
| Date | Buyer | Sale Price | Title Company |
|---|---|---|---|
| Morfin Anthony G | $190,000 | Chicago Title Co |
Source: Public Records
Mortgage History
| Date | Status | Borrower | Loan Amount |
|---|---|---|---|
| Previous Owner | Morfin Anthony G | $70,000 |
Source: Public Records
Tax History
| Year | Tax Paid | Tax Assessment Tax Assessment Total Assessment is a certain percentage of the fair market value that is determined by local assessors to be the total taxable value of land and additions on the property. | Land | Improvement |
|---|---|---|---|---|
| 2025 | $810 | $83,030 | $4,892 | $78,138 |
| 2024 | $810 | $81,403 | $4,797 | $76,606 |
| 2023 | $786 | $79,807 | $4,703 | $75,104 |
| 2022 | $749 | $78,243 | $4,611 | $73,632 |
| 2021 | $749 | $76,709 | $4,521 | $72,188 |
| 2020 | $734 | $75,923 | $4,475 | $71,448 |
| 2019 | $720 | $74,434 | $4,387 | $70,047 |
| 2018 | $692 | $72,975 | $4,301 | $68,674 |
| 2017 | $692 | $71,544 | $4,217 | $67,327 |
| 2016 | $669 | $70,141 | $4,134 | $66,007 |
| 2015 | $648 | $69,088 | $4,072 | $65,016 |
| 2014 | $648 | $67,734 | $3,992 | $63,742 |
Source: Public Records
Map
Nearby Homes
- 237 E Modoc Ave
- 438 E Oakridge Ct
- 811 E Trinidad Ave
- 223 W Buena Vista Ave
- 203 E Harold Ct
- 924 E Oakridge Ave
- 922 E Oakridge Ave
- 219 E Elowin Ct
- 201 E Elowin Ct
- 2241 N Edison St
- 2234 N Edison St
- 1205 E Ferguson Ave
- 441 W Glenhaven Ct
- 1540 N Encina St
- 1217 E Ferguson Ave
- 0 W Ferguson Ave Unit 214901
- 1420 N Court St
- 1432 N Locust St
- 0 N Ben Maddox Way NE Unit 238146
- 315 NE 3rd Ave
- 2203 N Bridge St
- 2135 N Bridge St
- 2146 N Mora Ct
- 2142 N Mora Ct
- 2123 N Bridge St
- 2150 N Mora Ct
- 2134 N Mora Ct
- 343 E Ferguson Ave
- 333 E Ferguson Ave
- 2119 N Bridge St
- 229 E Dove Ave
- 248 E Dove Ave
- 321 E Ferguson Ave
- 2204 N Bridge St
- 2208 N Bridge St
- 2128 N Bridge St
- 2117 N Bridge St
- 2145 N Mora Ct
- 2141 N Mora Ct
- 2222 N Bridge St
Your Personal Tour Guide
Ask me questions while you tour the home.