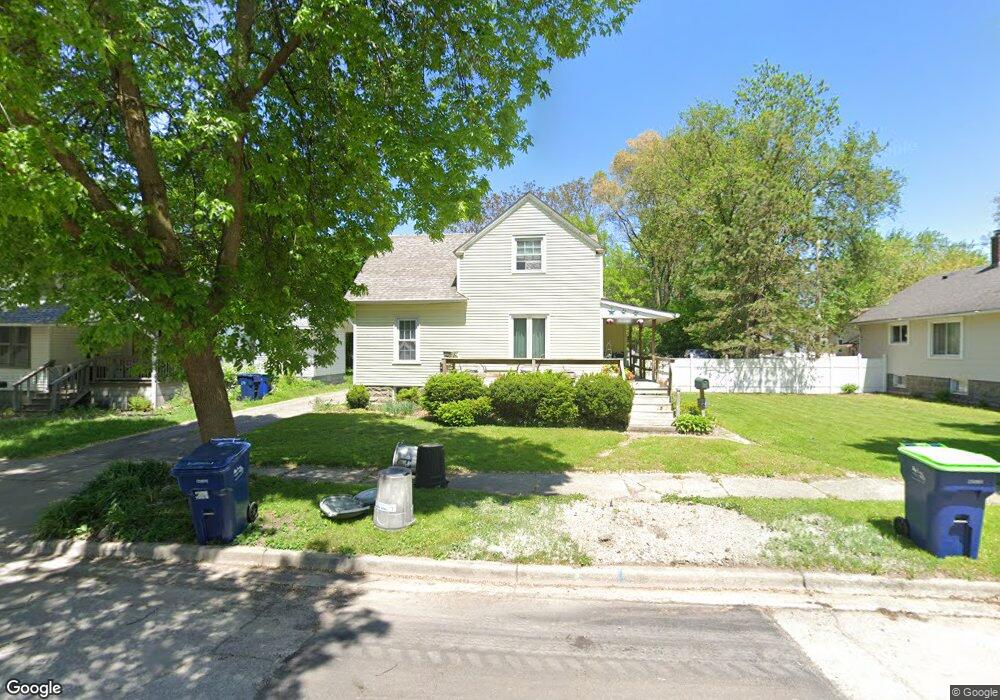
2141 2nd St Bay City, MI 48708
Estimated Value: $122,000 - $159,119
3
Beds
2
Baths
1,284
Sq Ft
$113/Sq Ft
Est. Value
About This Home
This home is located at 2141 2nd St, Bay City, MI 48708 and is currently estimated at $145,030, approximately $112 per square foot. 2141 2nd St is a home located in Bay County with nearby schools including Washington Elementary School, Handy Middle School, and Bay City Central High School.
Ownership History
Date
Name
Owned For
Owner Type
Purchase Details
Closed on
Apr 2, 2007
Sold by
Deutsche Bank National Trust Co
Bought by
Smith Chad
Current Estimated Value
Home Financials for this Owner
Home Financials are based on the most recent Mortgage that was taken out on this home.
Original Mortgage
$61,363
Interest Rate
6.2%
Mortgage Type
Balloon
Purchase Details
Closed on
Mar 10, 2006
Sold by
Vansumeren Robert John and Van Sumeren Christine A
Bought by
Deutsche Bank National Trust Co and Ameriquest Mortgage Securities Inc
Purchase Details
Closed on
Sep 24, 1999
Sold by
Bowyer Norma
Bought by
Vansumeren Robert and Vansumeren Christine
Create a Home Valuation Report for This Property
The Home Valuation Report is an in-depth analysis detailing your home's value as well as a comparison with similar homes in the area
Home Values in the Area
Average Home Value in this Area
Purchase History
| Date | Buyer | Sale Price | Title Company |
|---|---|---|---|
| Smith Chad | $60,770 | Fatic | |
| Deutsche Bank National Trust Co | $109,898 | None Available | |
| Vansumeren Robert | $73,000 | -- |
Source: Public Records
Mortgage History
| Date | Status | Borrower | Loan Amount |
|---|---|---|---|
| Closed | Smith Chad | $61,363 |
Source: Public Records
Tax History Compared to Growth
Tax History
| Year | Tax Paid | Tax Assessment Tax Assessment Total Assessment is a certain percentage of the fair market value that is determined by local assessors to be the total taxable value of land and additions on the property. | Land | Improvement |
|---|---|---|---|---|
| 2025 | $2,113 | $71,200 | $0 | $0 |
| 2024 | $1,739 | $64,100 | $0 | $0 |
| 2023 | $1,656 | $58,550 | $0 | $0 |
| 2022 | $1,902 | $50,850 | $0 | $0 |
| 2021 | $1,788 | $45,100 | $45,100 | $0 |
| 2020 | $1,902 | $41,250 | $41,250 | $0 |
| 2019 | $1,860 | $40,400 | $0 | $0 |
| 2018 | $1,841 | $39,350 | $0 | $0 |
| 2017 | $1,801 | $39,100 | $0 | $0 |
| 2016 | $1,792 | $38,300 | $0 | $38,300 |
| 2015 | $1,741 | $38,350 | $0 | $38,350 |
| 2014 | $1,741 | $40,600 | $0 | $40,600 |
Source: Public Records
Map
Nearby Homes