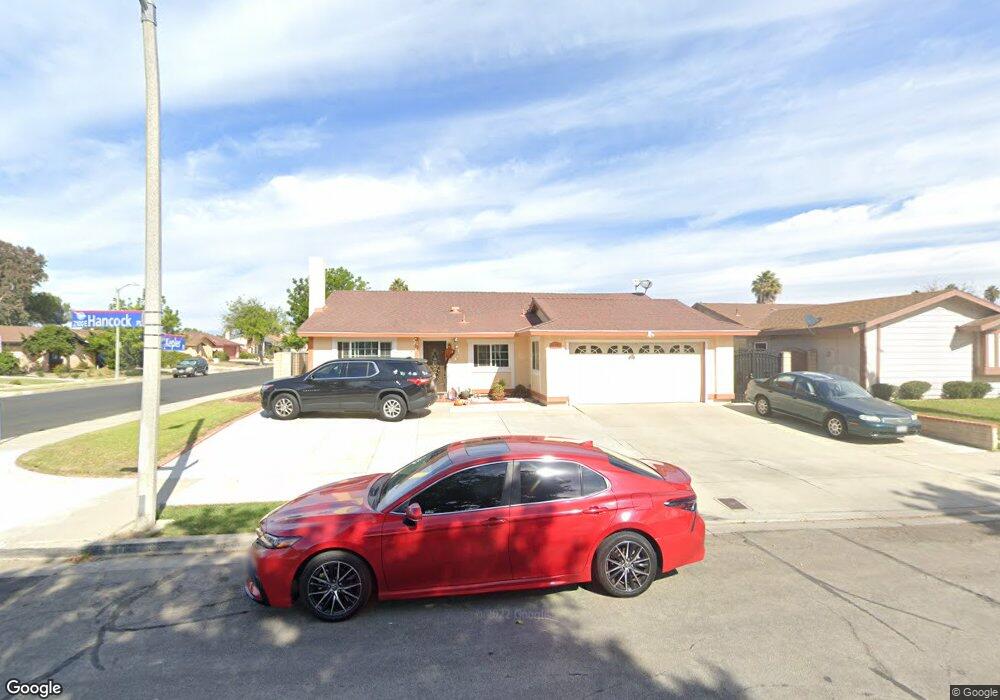
2141 Hancock Place Oxnard, CA 93033
Lemonwood Eastmont NeighborhoodEstimated Value: $702,000 - $753,000
3
Beds
2
Baths
1,076
Sq Ft
$678/Sq Ft
Est. Value
About This Home
This home is located at 2141 Hancock Place, Oxnard, CA 93033 and is currently estimated at $729,203, approximately $677 per square foot. 2141 Hancock Place is a home located in Ventura County with nearby schools including Lemonwood Elementary School, R.J. Frank Academy of Marine Science & Engineering, and Channel Islands High School.
Ownership History
Date
Name
Owned For
Owner Type
Purchase Details
Closed on
Jun 17, 2008
Sold by
Torres Jose Luis
Bought by
Torres Jose Luis
Current Estimated Value
Purchase Details
Closed on
May 17, 2004
Sold by
Torres Maria E
Bought by
Torres Jose Luis
Home Financials for this Owner
Home Financials are based on the most recent Mortgage that was taken out on this home.
Original Mortgage
$225,000
Outstanding Balance
$107,493
Interest Rate
5.77%
Mortgage Type
New Conventional
Estimated Equity
$621,710
Purchase Details
Closed on
Jun 3, 1994
Sold by
Torres Jose Luis and Torres Maria E
Bought by
Torres Jose Luis and Torres Maria E
Home Financials for this Owner
Home Financials are based on the most recent Mortgage that was taken out on this home.
Original Mortgage
$103,317
Interest Rate
8.35%
Create a Home Valuation Report for This Property
The Home Valuation Report is an in-depth analysis detailing your home's value as well as a comparison with similar homes in the area
Home Values in the Area
Average Home Value in this Area
Purchase History
| Date | Buyer | Sale Price | Title Company |
|---|---|---|---|
| Torres Jose Luis | -- | None Available | |
| Torres Jose Luis | -- | First American Title Co | |
| Torres Jose Luis | -- | Gateway Title Co |
Source: Public Records
Mortgage History
| Date | Status | Borrower | Loan Amount |
|---|---|---|---|
| Open | Torres Jose Luis | $225,000 | |
| Closed | Torres Jose Luis | $103,317 |
Source: Public Records
Tax History Compared to Growth
Tax History
| Year | Tax Paid | Tax Assessment Tax Assessment Total Assessment is a certain percentage of the fair market value that is determined by local assessors to be the total taxable value of land and additions on the property. | Land | Improvement |
|---|---|---|---|---|
| 2025 | $3,080 | $258,019 | $77,041 | $180,978 |
| 2024 | $3,080 | $252,960 | $75,530 | $177,430 |
| 2023 | $2,967 | $248,000 | $74,049 | $173,951 |
| 2022 | $2,877 | $243,138 | $72,597 | $170,541 |
| 2021 | $2,853 | $238,371 | $71,173 | $167,198 |
| 2020 | $4,672 | $235,930 | $70,445 | $165,485 |
| 2019 | $4,589 | $231,305 | $69,064 | $162,241 |
| 2018 | $4,543 | $226,770 | $67,710 | $159,060 |
| 2017 | $4,382 | $222,325 | $66,383 | $155,942 |
| 2016 | $4,293 | $217,967 | $65,082 | $152,885 |
| 2015 | $2,572 | $214,695 | $64,105 | $150,590 |
| 2014 | $2,542 | $210,491 | $62,850 | $147,641 |
Source: Public Records
Map
Nearby Homes
- 2630 El Dorado Ave Unit B
- 1864 San Mateo Place
- 1853 Ives Ave Unit 61
- 2733 Tolstoy Place Unit 104
- 0 Oxnard Blvd Unit 25590841
- 2136 Thrush Ave Unit 2136
- 2143 Cardinal Ave Unit 2143
- 1004 Cheyenne Way
- 2374 Nash Ln
- 4108 Ranchita Ln
- 3039 Fournier St
- 4210 Drake Dr
- 1220 Lindsay Place
- 1630 Nelson Place
- 3151 Fournier St
- 840 Morro Way
- 4440 Reeder Ave
- 2064 Walden St
- 168 Lark St
- 167 Hughes Dr
- 2145 Hancock Place
- 2140 Gershwin Place
- 2144 Gershwin Place
- 2151 Hancock Place
- 2021 Kepler Dr
- 2031 Kepler Dr
- 2140 Hancock Place
- 2150 Gershwin Place
- 2011 Kepler Dr
- 2101 Kepler Dr
- 2144 Hancock Place
- 2155 Hancock Place
- 2001 Kepler Dr
- 2150 Hancock Place
- 2111 Kepler Dr
- 2154 Gershwin Place
- 1960 Kepler Dr
- 2154 Hancock Place
- 2161 Hancock Place
- 1961 Kepler Dr