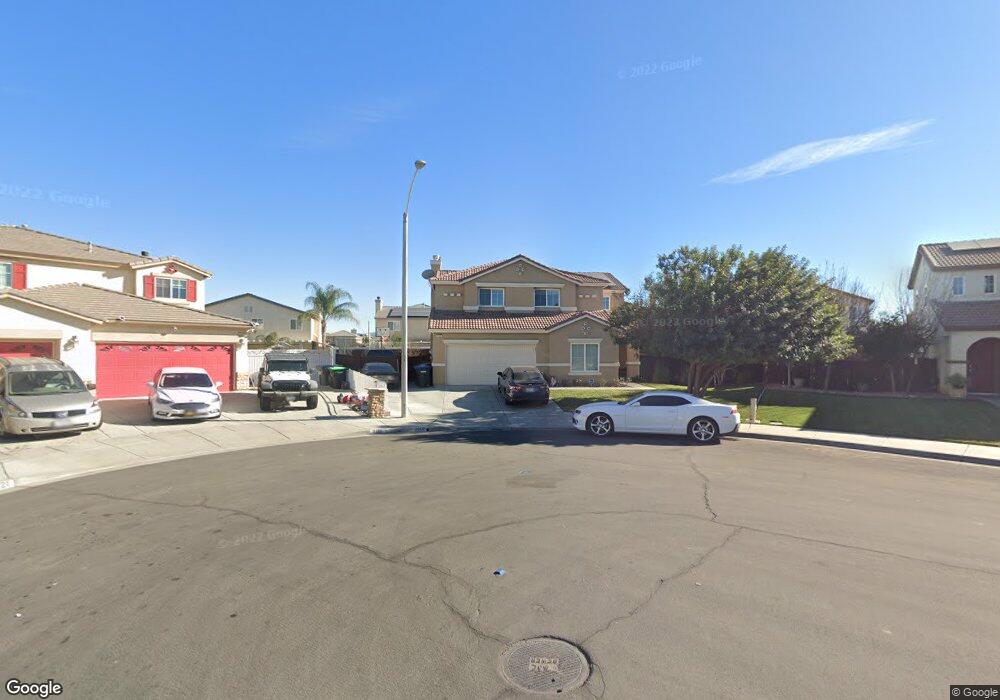
2142 Lavender Ct San Jacinto, CA 92582
Equestrian Downs NeighborhoodEstimated Value: $531,832 - $548,000
6
Beds
3
Baths
2,382
Sq Ft
$226/Sq Ft
Est. Value
About This Home
This home is located at 2142 Lavender Ct, San Jacinto, CA 92582 and is currently estimated at $537,708, approximately $225 per square foot. 2142 Lavender Ct is a home located in Riverside County with nearby schools including Fruitvale Elementary School, Rancho Viejo Middle School, and Tahquitz High School.
Ownership History
Date
Name
Owned For
Owner Type
Purchase Details
Closed on
Jul 31, 2009
Sold by
Gmac Mortgage Llc
Bought by
Cuellar Delila and Cuellar Emmanuel
Current Estimated Value
Home Financials for this Owner
Home Financials are based on the most recent Mortgage that was taken out on this home.
Original Mortgage
$141,391
Interest Rate
5.25%
Mortgage Type
FHA
Purchase Details
Closed on
Jun 10, 2009
Sold by
Salazar Maximiliano
Bought by
Gmac Mortgage Llc and Gmac Mortgage Corporation
Home Financials for this Owner
Home Financials are based on the most recent Mortgage that was taken out on this home.
Original Mortgage
$141,391
Interest Rate
5.25%
Mortgage Type
FHA
Purchase Details
Closed on
Apr 12, 2006
Sold by
Salazar Virginia
Bought by
Salazar Maximiliano
Home Financials for this Owner
Home Financials are based on the most recent Mortgage that was taken out on this home.
Original Mortgage
$314,950
Interest Rate
6.41%
Mortgage Type
Fannie Mae Freddie Mac
Create a Home Valuation Report for This Property
The Home Valuation Report is an in-depth analysis detailing your home's value as well as a comparison with similar homes in the area
Home Values in the Area
Average Home Value in this Area
Purchase History
| Date | Buyer | Sale Price | Title Company |
|---|---|---|---|
| Cuellar Delila | $144,000 | Fidelity National Title Co | |
| Gmac Mortgage Llc | $139,000 | None Available | |
| Salazar Maximiliano | -- | North American Title | |
| Salazar Maximiliano | $350,000 | North American Title Company |
Source: Public Records
Mortgage History
| Date | Status | Borrower | Loan Amount |
|---|---|---|---|
| Previous Owner | Cuellar Delila | $141,391 | |
| Previous Owner | Salazar Maximiliano | $314,950 |
Source: Public Records
Tax History Compared to Growth
Tax History
| Year | Tax Paid | Tax Assessment Tax Assessment Total Assessment is a certain percentage of the fair market value that is determined by local assessors to be the total taxable value of land and additions on the property. | Land | Improvement |
|---|---|---|---|---|
| 2025 | $4,835 | $199,174 | $64,531 | $134,643 |
| 2023 | $4,835 | $191,441 | $62,026 | $129,415 |
| 2022 | $7,078 | $187,688 | $60,810 | $126,878 |
| 2021 | $6,949 | $184,009 | $59,618 | $124,391 |
| 2020 | $6,778 | $182,123 | $59,007 | $123,116 |
| 2019 | $6,715 | $172,652 | $57,850 | $114,802 |
| 2018 | $6,578 | $169,267 | $56,717 | $112,550 |
| 2017 | $3,964 | $160,149 | $55,605 | $104,544 |
| 2016 | $3,856 | $157,010 | $54,515 | $102,495 |
| 2015 | $3,772 | $154,654 | $53,698 | $100,956 |
| 2014 | $3,632 | $151,627 | $52,648 | $98,979 |
Source: Public Records
Map
Nearby Homes
- 2121 Lavender Ct
- 2096 Wild Thyme Place
- 2182 Larkspur Ct
- 1966 El Milagro Rd
- 1977 Connor Ln
- Residence 2 Plan at Kirby Estates
- Residence 1 Plan at Kirby Estates
- Residence 3 Plan at Kirby Estates
- 7 W 7th St
- 0 S Sanderson Ave
- 1821 Whispering Bells Rd
- 1245 Auburn St
- 3494 Catalina Ave
- 1821 Bridle Trail
- 1817 W 7th St
- 392 Camden Rd
- 492 S Sanderson Ave
- 3216 Pepper St
- 1151 Tori Dr
- 1250 N Kirby St Unit 55
- 2164 Lavender Ct
- 754 Sweet Clover Loop
- 752 Sweet Clover Loop
- 756 Sweet Clover Loop
- 750 Sweet Clover Loop
- 2132 Lavender Ct
- 2176 Lavender Ct
- 758 Sweet Clover Loop
- 2143 Lavender Ct
- 748 Sweet Clover Loop
- 2169 Lavender Ct
- 2187 Lavender Ct
- 746 Sweet Clover Loop
- 760 Sweet Clover Loop
- 2190 Lavender Ct
- 2118 Possum Ct
- 2144 Farm Meadows Dr
- 2191 Lavender Ct
- 751 Sweet Clover Loop
- 2166 Farm Meadows Dr