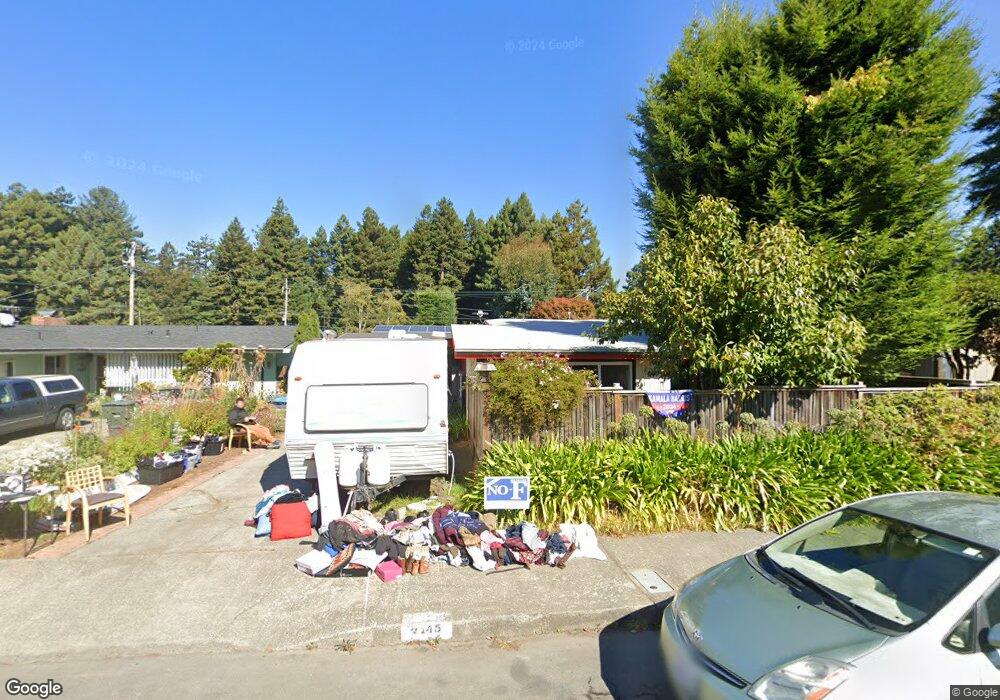
2145 Everding St Eureka, CA 95503
Estimated Value: $357,652 - $424,000
Studio
--
Bath
--
Sq Ft
6,621
Sq Ft Lot
About This Home
This home is located at 2145 Everding St, Eureka, CA 95503 and is currently estimated at $391,413. 2145 Everding St is a home located in Humboldt County with nearby schools including Washington Elementary School, Catherine L. Zane Middle School, and Eureka Senior High School.
Ownership History
Date
Name
Owned For
Owner Type
Purchase Details
Closed on
Sep 1, 2016
Sold by
Portugal Peter N and Portugal Sue Kathleen
Bought by
Portugal Peter and Portugal Sue
Current Estimated Value
Home Financials for this Owner
Home Financials are based on the most recent Mortgage that was taken out on this home.
Original Mortgage
$160,000
Outstanding Balance
$127,802
Interest Rate
3.43%
Mortgage Type
Credit Line Revolving
Estimated Equity
$263,611
Purchase Details
Closed on
Jul 19, 2016
Sold by
Portugal Peter N
Bought by
Portugal Peter N and Portugal Sue Kathleen
Home Financials for this Owner
Home Financials are based on the most recent Mortgage that was taken out on this home.
Original Mortgage
$160,000
Outstanding Balance
$127,802
Interest Rate
3.43%
Mortgage Type
Credit Line Revolving
Estimated Equity
$263,611
Purchase Details
Closed on
May 25, 1999
Sold by
Portugal Dorothy M
Bought by
Portugal Dorothy M and Dorothy M Portugal 1999 Living
Create a Home Valuation Report for This Property
The Home Valuation Report is an in-depth analysis detailing your home's value as well as a comparison with similar homes in the area
Purchase History
| Date | Buyer | Sale Price | Title Company |
|---|---|---|---|
| Portugal Peter | -- | Fidelity Natl Title Co Of Ca | |
| Portugal Peter N | -- | None Available | |
| Portugal Peter N | -- | None Available | |
| Portugal Dorothy M | -- | -- |
Source: Public Records
Mortgage History
| Date | Status | Borrower | Loan Amount |
|---|---|---|---|
| Open | Portugal Peter | $160,000 |
Source: Public Records
Tax History
| Year | Tax Paid | Tax Assessment Tax Assessment Total Assessment is a certain percentage of the fair market value that is determined by local assessors to be the total taxable value of land and additions on the property. | Land | Improvement |
|---|---|---|---|---|
| 2025 | $971 | $101,547 | $16,850 | $84,697 |
| 2024 | $971 | $99,557 | $16,520 | $83,037 |
| 2023 | $956 | $97,606 | $16,197 | $81,409 |
| 2022 | $991 | $95,693 | $15,880 | $79,813 |
| 2021 | $926 | $93,818 | $15,569 | $78,249 |
| 2020 | $919 | $92,857 | $15,410 | $77,447 |
| 2019 | $898 | $91,037 | $15,108 | $75,929 |
| 2018 | $883 | $89,253 | $14,812 | $74,441 |
| 2017 | $878 | $87,504 | $14,522 | $72,982 |
| 2016 | $954 | $85,789 | $14,238 | $71,551 |
| 2015 | $867 | $84,502 | $14,025 | $70,477 |
| 2014 | $809 | $82,848 | $13,751 | $69,097 |
Source: Public Records
Map
Nearby Homes
Your Personal Tour Guide
Ask me questions while you tour the home.