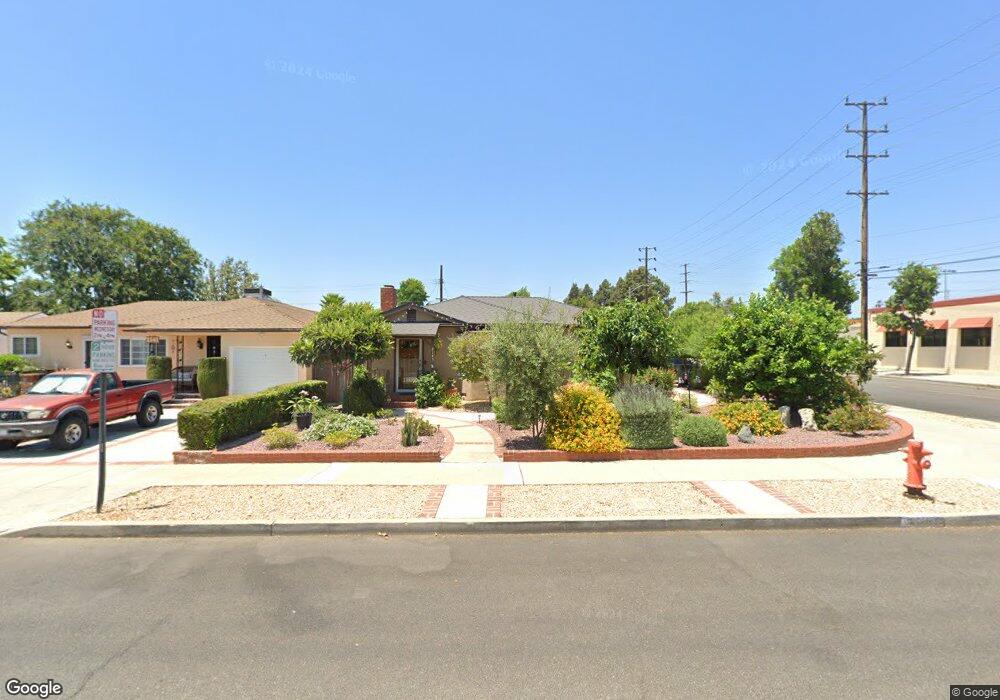
2145 N Pepper St Burbank, CA 91505
Northwest District NeighborhoodEstimated Value: $1,115,212 - $1,411,000
4
Beds
3
Baths
2,016
Sq Ft
$637/Sq Ft
Est. Value
About This Home
This home is located at 2145 N Pepper St, Burbank, CA 91505 and is currently estimated at $1,285,053, approximately $637 per square foot. 2145 N Pepper St is a home located in Los Angeles County with nearby schools including Providencia Elementary School, Luther Burbank Middle School, and Burbank High School.
Ownership History
Date
Name
Owned For
Owner Type
Purchase Details
Closed on
Apr 29, 2023
Sold by
Lopez Luz Rubemia
Bought by
Lopez Luz Rubemia and Lopez Guadalupe Luz
Current Estimated Value
Purchase Details
Closed on
May 25, 1994
Sold by
Slayden Clara M
Bought by
Luz Efrain Trejo
Home Financials for this Owner
Home Financials are based on the most recent Mortgage that was taken out on this home.
Original Mortgage
$128,000
Interest Rate
3.95%
Create a Home Valuation Report for This Property
The Home Valuation Report is an in-depth analysis detailing your home's value as well as a comparison with similar homes in the area
Home Values in the Area
Average Home Value in this Area
Purchase History
| Date | Buyer | Sale Price | Title Company |
|---|---|---|---|
| Lopez Luz Rubemia | -- | None Listed On Document | |
| Luz Efrain Trejo | $160,000 | Stewart Title |
Source: Public Records
Mortgage History
| Date | Status | Borrower | Loan Amount |
|---|---|---|---|
| Previous Owner | Luz Efrain Trejo | $128,000 |
Source: Public Records
Tax History
| Year | Tax Paid | Tax Assessment Tax Assessment Total Assessment is a certain percentage of the fair market value that is determined by local assessors to be the total taxable value of land and additions on the property. | Land | Improvement |
|---|---|---|---|---|
| 2025 | $4,310 | $373,879 | $150,654 | $223,225 |
| 2024 | $4,310 | $366,549 | $147,700 | $218,849 |
| 2023 | $4,266 | $359,362 | $144,804 | $214,558 |
| 2022 | $4,077 | $352,316 | $141,965 | $210,351 |
| 2021 | $4,051 | $345,409 | $139,182 | $206,227 |
| 2019 | $3,892 | $335,165 | $135,054 | $200,111 |
| 2018 | $3,790 | $328,594 | $132,406 | $196,188 |
| 2016 | $3,583 | $315,836 | $127,265 | $188,571 |
| 2015 | $3,512 | $311,093 | $125,354 | $185,739 |
| 2014 | $3,508 | $305,000 | $122,899 | $182,101 |
Source: Public Records
Map
Nearby Homes
- 2129 N Pepper St
- 2144 N Pepper St
- 2117 N Screenland Dr
- 2016 N Screenland Dr
- 3621 W Victory Blvd
- 2144 N Pass Ave
- 2115 N Pass
- 2140 N Rose St
- 1809 N Fairview St
- 1902 N Pass Ave
- 3013 W Victory Blvd
- 1817 N Hollywood Way
- 3009 W Victory Blvd
- 1735 N Lima St
- 2213 N Valley St
- 3007 W Victory Blvd
- 2012 N Fairview St
- 11214 W Victory Blvd Unit 6
- 1532 N Ontario St
- 1713 N Pepper St
- 2141 N Pepper St
- 2137 N Pepper St
- 2144 N Screenland Dr
- 2140 N Screenland Dr
- 2133 N Pepper St
- 2136 N Screenland Dr
- 2131 N Pepper St
- 2140 N Pepper St
- 2132 N Screenland Dr
- 2136 N Pepper St
- 2128 N Screenland Dr
- 2132 N Pepper St
- 2125 N Pepper St
- 2128 N Pepper St
- 2124 N Screenland Dr
- 2121 N Pepper St
- 2124 N Pepper St
- 2120 N Screenland Dr
- 2141 N Hollywood Way
- 2145 N Screenland Dr
Your Personal Tour Guide
Ask me questions while you tour the home.