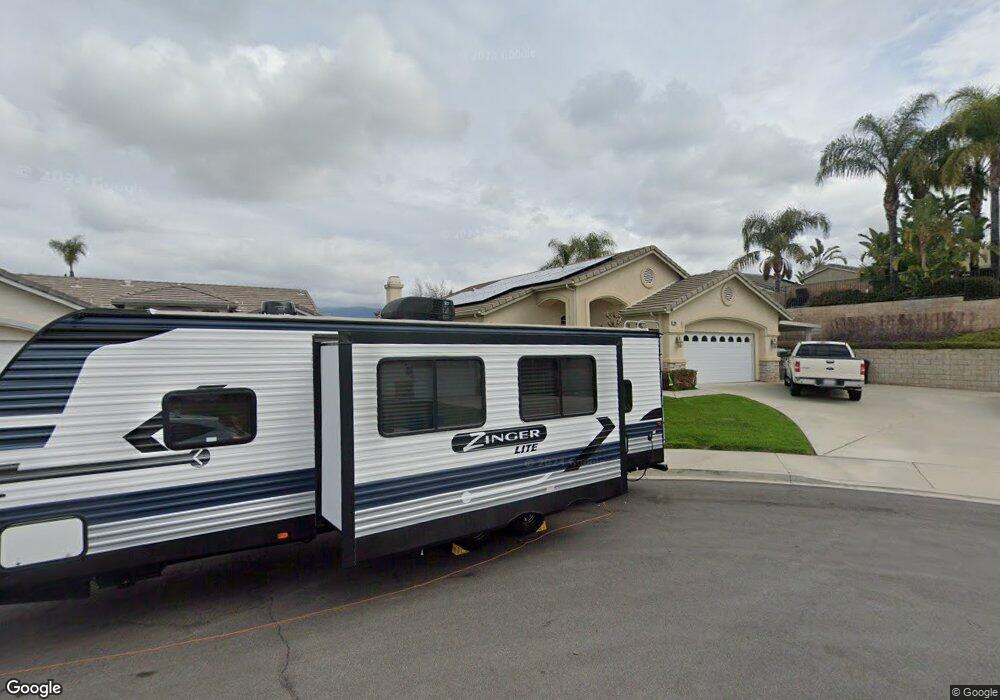
2149 Maple Ct Mentone, CA 92359
Estimated Value: $585,000 - $671,000
4
Beds
2
Baths
2,221
Sq Ft
$284/Sq Ft
Est. Value
About This Home
This home is located at 2149 Maple Ct, Mentone, CA 92359 and is currently estimated at $631,338, approximately $284 per square foot. 2149 Maple Ct is a home located in San Bernardino County with nearby schools including Mentone Elementary School, Moore Middle School, and Redlands East Valley High School.
Ownership History
Date
Name
Owned For
Owner Type
Purchase Details
Closed on
Jul 22, 2020
Sold by
Dinnauer Joel B and Dinnauer Pauline M
Bought by
Dinnauer Joel B and Dinnauer Pauline
Current Estimated Value
Purchase Details
Closed on
Feb 11, 2008
Sold by
Dinnauer Pauline M
Bought by
Dinnauer Joel B and Dinnauer Pauline M
Home Financials for this Owner
Home Financials are based on the most recent Mortgage that was taken out on this home.
Original Mortgage
$169,000
Interest Rate
5.85%
Mortgage Type
New Conventional
Purchase Details
Closed on
May 19, 2004
Sold by
Tyler Pauline M
Bought by
Tyler Pauline M and The Pauline M Tyler Living Tru
Purchase Details
Closed on
Sep 15, 2003
Sold by
Tyler Kenneth R
Bought by
Tyler Pauline M
Purchase Details
Closed on
Nov 5, 2001
Sold by
De Sousa Development
Bought by
Tyler Kenneth R and Tyler Pauline M
Home Financials for this Owner
Home Financials are based on the most recent Mortgage that was taken out on this home.
Original Mortgage
$183,350
Interest Rate
6.57%
Create a Home Valuation Report for This Property
The Home Valuation Report is an in-depth analysis detailing your home's value as well as a comparison with similar homes in the area
Home Values in the Area
Average Home Value in this Area
Purchase History
| Date | Buyer | Sale Price | Title Company |
|---|---|---|---|
| Dinnauer Joel B | -- | None Available | |
| Dinnauer Joel B | -- | Chicago Title Company | |
| Tyler Pauline M | -- | -- | |
| Tyler Pauline M | -- | -- | |
| Tyler Kenneth R | $193,000 | Orange Coast Title |
Source: Public Records
Mortgage History
| Date | Status | Borrower | Loan Amount |
|---|---|---|---|
| Closed | Dinnauer Joel B | $169,000 | |
| Closed | Tyler Kenneth R | $183,350 |
Source: Public Records
Tax History
| Year | Tax Paid | Tax Assessment Tax Assessment Total Assessment is a certain percentage of the fair market value that is determined by local assessors to be the total taxable value of land and additions on the property. | Land | Improvement |
|---|---|---|---|---|
| 2025 | $3,950 | $311,393 | $59,093 | $252,300 |
| 2024 | $3,692 | $305,287 | $57,934 | $247,353 |
| 2023 | $3,681 | $299,301 | $56,798 | $242,503 |
| 2022 | $3,623 | $293,432 | $55,684 | $237,748 |
| 2021 | $3,680 | $287,678 | $54,592 | $233,086 |
| 2020 | $3,622 | $284,728 | $54,032 | $230,696 |
| 2019 | $3,523 | $279,146 | $52,973 | $226,173 |
| 2018 | $3,279 | $273,672 | $51,934 | $221,738 |
| 2017 | $3,250 | $268,306 | $50,916 | $217,390 |
| 2016 | $3,211 | $263,045 | $49,918 | $213,127 |
| 2015 | $3,186 | $259,094 | $49,168 | $209,926 |
| 2014 | $3,121 | $254,019 | $48,205 | $205,814 |
Source: Public Records
Map
Nearby Homes
- 2140 Mentone Blvd Unit 43
- 1365 Crafton Ave Unit 1089
- 1365 Crafton Ave Unit 2101
- 1246 Venice Ave
- 1176 Woodbury Ln
- 1212 Venice Ave
- 2168 Stonewood St
- 2058 Anzio Ave
- 1373 Agate Ave
- 31025 Quarry St
- 1255 Amethyst Ave Unit 21
- 1255 Amethyst Ave Unit 24
- 1337 Beryl Ave
- 1255 Amethyst Ave Unit 18
- 1232 Turquoise Ave
- 1226 Turquoise Ave
- 2456 Mill Creek Rd
- 1568 Pintail St
- 1558 Oriole St
- 1260 Via Barcelona
- 2145 Maple Ct
- 1351 Plumwood Ln
- 1345 Plumwood Ln
- 2141 Maple Ct
- 1354 Whitewood Dr
- 2150 Maple Ct
- 1355 Whitewood Dr
- 2137 Maple Ct
- 2146 Maple Ct
- 1357 Plumwood Ln
- 1333 Plumwood Ln
- 1360 Whitewood Dr
- 2142 Maple Ct
- 1202 Maplewood Ln
- 1363 Plumwood Ln
- 2138 Maple Ct
- 1212 Maplewood Ln
- 1366 Whitewood Dr
- 1327 Plumwood Ln
- 1367 Whitewood Dr
Your Personal Tour Guide
Ask me questions while you tour the home.