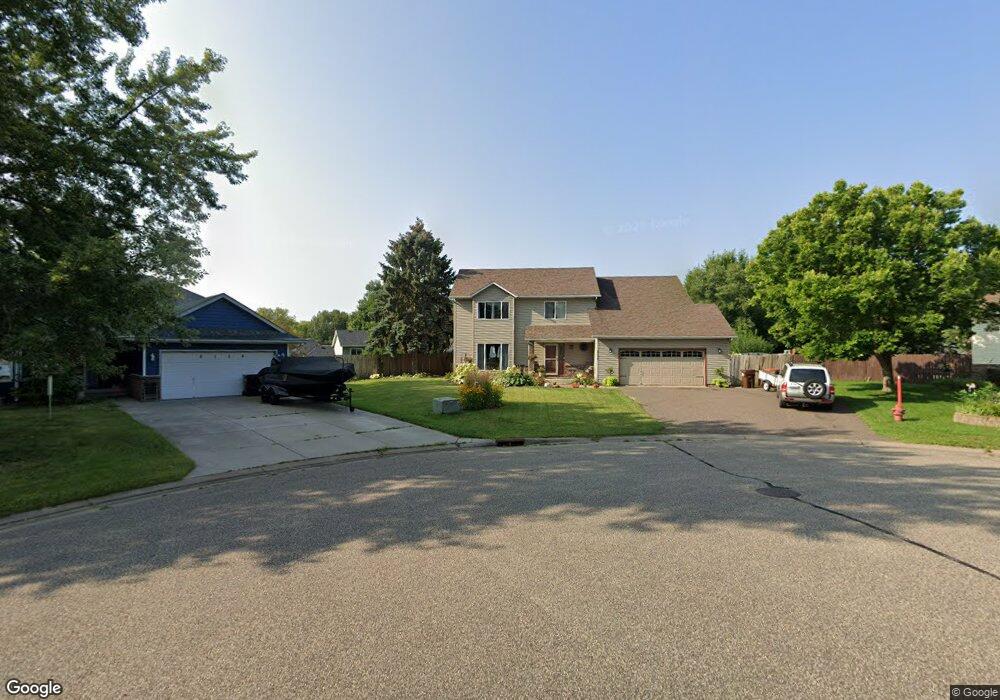
2150 Hallmark Way N Saint Paul, MN 55128
Estimated Value: $435,000 - $478,000
4
Beds
4
Baths
2,192
Sq Ft
$207/Sq Ft
Est. Value
About This Home
This home is located at 2150 Hallmark Way N, Saint Paul, MN 55128 and is currently estimated at $453,804, approximately $207 per square foot. 2150 Hallmark Way N is a home located in Washington County with nearby schools including Skyview Community Elementary School, Skyview Community Middle School, and Tartan Senior High School.
Ownership History
Date
Name
Owned For
Owner Type
Purchase Details
Closed on
Aug 22, 2016
Sold by
Peabody Amber J and Schissel Michael T
Bought by
Peabody Amber J and Schissel Michael T
Current Estimated Value
Purchase Details
Closed on
May 8, 2015
Sold by
Bliven Jerry A and Bliven Aimee H
Bought by
Lang Amber J
Home Financials for this Owner
Home Financials are based on the most recent Mortgage that was taken out on this home.
Original Mortgage
$253,500
Outstanding Balance
$194,861
Interest Rate
3.62%
Mortgage Type
New Conventional
Estimated Equity
$258,943
Purchase Details
Closed on
Nov 22, 2010
Sold by
Beletsky Andrei and Beletsky Victoria
Bought by
Bliven Jerry A and Bliven Aimee H
Home Financials for this Owner
Home Financials are based on the most recent Mortgage that was taken out on this home.
Original Mortgage
$226,160
Interest Rate
4.19%
Mortgage Type
VA
Purchase Details
Closed on
Sep 19, 2005
Sold by
Harrington Douglas E and Harrington Jeannine A
Bought by
Heinn Cory M
Create a Home Valuation Report for This Property
The Home Valuation Report is an in-depth analysis detailing your home's value as well as a comparison with similar homes in the area
Home Values in the Area
Average Home Value in this Area
Purchase History
| Date | Buyer | Sale Price | Title Company |
|---|---|---|---|
| Peabody Amber J | -- | Attorney | |
| Lang Amber J | $267,000 | Premier Title Ins Agency Inc | |
| Bliven Jerry A | $221,400 | -- | |
| Heinn Cory M | $317,100 | -- |
Source: Public Records
Mortgage History
| Date | Status | Borrower | Loan Amount |
|---|---|---|---|
| Open | Lang Amber J | $253,500 | |
| Previous Owner | Bliven Jerry A | $226,160 |
Source: Public Records
Tax History Compared to Growth
Tax History
| Year | Tax Paid | Tax Assessment Tax Assessment Total Assessment is a certain percentage of the fair market value that is determined by local assessors to be the total taxable value of land and additions on the property. | Land | Improvement |
|---|---|---|---|---|
| 2024 | $4,762 | $410,600 | $110,000 | $300,600 |
| 2023 | $4,762 | $416,400 | $120,000 | $296,400 |
| 2022 | $3,384 | $370,100 | $100,800 | $269,300 |
| 2021 | $3,590 | $288,000 | $85,000 | $203,000 |
| 2020 | $3,592 | $302,700 | $100,000 | $202,700 |
| 2019 | $3,358 | $296,200 | $96,000 | $200,200 |
| 2018 | $3,242 | $279,600 | $90,000 | $189,600 |
| 2017 | $3,252 | $267,100 | $88,500 | $178,600 |
| 2016 | $3,026 | $254,300 | $80,000 | $174,300 |
| 2015 | -- | $228,800 | $66,500 | $162,300 |
| 2013 | -- | $224,800 | $60,800 | $164,000 |
Source: Public Records
Map
Nearby Homes
- 7018 19th St N Unit 1
- 2033 Gresham Ave N
- 2001 Gresham Ave N Unit 18
- 2181 Helena Rd N
- 2059 Gresham Ave N
- 2056 Gresham Ave N
- 7061 Upper 17th St N
- 2404 Helena Ave N
- 2477 Grenadier Ave N
- 1754 Helena Rd N
- 1920 Heath Ave N
- 2569 Hayward Ave N
- 7492 Upper 24th St N
- 6551 22nd St N
- 6510 23rd St N
- 7697 Upper 20th St N
- 1612 Helena Rd N
- 1580 Helmo Ave N Unit 1580
- 7602 26th St N
- 2232 Homestead Ave N
- 2154 Hallmark Way N
- 2134 Hallmark Way N
- 2112 Hallmark Ave N
- 2114 Hallmark Ave N
- 2110 Hallmark Ave N
- 2116 Hallmark Ave N
- 2170 Hallmark Way N
- 2137 Hale Ave N
- 2132 Hallmark Way N
- 2155 Hale Ave N
- 2120 Hallmark Ave N
- 2108 Hallmark Ave N
- 2173 Hale Ave N
- 2130 Hallmark Ave N
- 2182 Hallmark Way N
- 2164 Hallmark Ave N
- 2140 Hallmark Ave N
- 2183 Hallmark Way N
- 2180 Hallmark Ave N
- 2113 Hallmark Ave N