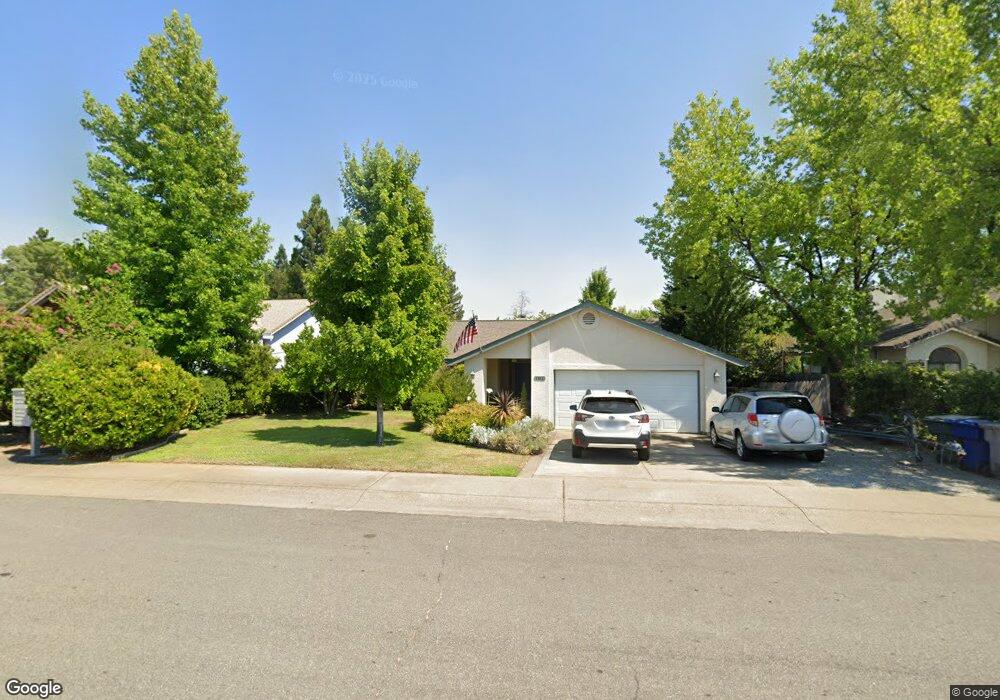
2153 Hacienda St Unit 1 Redding, CA 96003
Simpson University Region NeighborhoodEstimated Value: $430,366 - $444,000
4
Beds
2
Baths
1,800
Sq Ft
$243/Sq Ft
Est. Value
About This Home
This home is located at 2153 Hacienda St Unit 1, Redding, CA 96003 and is currently estimated at $437,842, approximately $243 per square foot. 2153 Hacienda St Unit 1 is a home located in Shasta County with nearby schools including Columbia Elementary School, Mountain View Middle School, and Foothill High School.
Ownership History
Date
Name
Owned For
Owner Type
Purchase Details
Closed on
May 7, 2021
Sold by
Meurer David M and Meurer Dale K
Bought by
Meurer David and Meurer Dale
Current Estimated Value
Purchase Details
Closed on
Aug 13, 2002
Sold by
Long Cheffet Shelbie D and Brady Cheffet S
Bought by
Meurer David M and Meurer Dale K
Home Financials for this Owner
Home Financials are based on the most recent Mortgage that was taken out on this home.
Original Mortgage
$174,800
Outstanding Balance
$73,331
Interest Rate
6.43%
Estimated Equity
$364,511
Purchase Details
Closed on
Aug 26, 1999
Sold by
Romero Charles N and Romero Tammy S
Bought by
Long Shelbie D
Home Financials for this Owner
Home Financials are based on the most recent Mortgage that was taken out on this home.
Original Mortgage
$128,205
Interest Rate
7.47%
Mortgage Type
FHA
Create a Home Valuation Report for This Property
The Home Valuation Report is an in-depth analysis detailing your home's value as well as a comparison with similar homes in the area
Home Values in the Area
Average Home Value in this Area
Purchase History
| Date | Buyer | Sale Price | Title Company |
|---|---|---|---|
| Meurer David | -- | None Available | |
| Meurer David M | $184,000 | Placer Title Company | |
| Long Shelbie D | $132,500 | Placer Title Company |
Source: Public Records
Mortgage History
| Date | Status | Borrower | Loan Amount |
|---|---|---|---|
| Open | Meurer David M | $174,800 | |
| Previous Owner | Long Shelbie D | $128,205 |
Source: Public Records
Tax History Compared to Growth
Tax History
| Year | Tax Paid | Tax Assessment Tax Assessment Total Assessment is a certain percentage of the fair market value that is determined by local assessors to be the total taxable value of land and additions on the property. | Land | Improvement |
|---|---|---|---|---|
| 2025 | $2,850 | $266,470 | $50,680 | $215,790 |
| 2024 | $2,858 | $261,246 | $49,687 | $211,559 |
| 2023 | $2,858 | $256,124 | $48,713 | $207,411 |
| 2022 | $2,755 | $251,103 | $47,758 | $203,345 |
| 2021 | $2,760 | $246,180 | $46,822 | $199,358 |
| 2020 | $2,718 | $243,656 | $46,342 | $197,314 |
| 2019 | $2,654 | $238,880 | $45,434 | $193,446 |
| 2018 | $2,694 | $234,197 | $44,544 | $189,653 |
| 2017 | $2,723 | $229,606 | $43,671 | $185,935 |
| 2016 | $2,551 | $225,105 | $42,815 | $182,290 |
| 2015 | $2,511 | $221,724 | $42,172 | $179,552 |
| 2014 | $2,233 | $200,000 | $35,000 | $165,000 |
Source: Public Records
Map
Nearby Homes
- 550 Armando Ave
- 2110 Cilantro Dr
- 2154 Harvard Way
- 693 Yolla Bolly Trail
- 006 Old Oregon Trail
- 790 Volcano View Trail
- 1891 Edgewood Dr
- 1187 Kirkwood Cir
- 624 Volcano View Trail
- 40 Ortega Ct
- 667 Reddington Dr
- 1381 Chaos Walk
- 60 Rose Ln
- 1401 Casa Vereda Way
- 2238 Sophy Place
- 1285 Lancers Ln
- 953 Tanglewood Dr
- 19219 Nike Ct
- 2517 Atrium Way
- 654 Rogue River Way
- 2153 Hacienda St
- 2161 Hacienda St
- 2145 Hacienda St
- 2160 Hemingway St
- 2154 Hemingway St
- 2169 Hacienda St
- 2137 Hacienda St
- 2148 Hemingway St
- 2166 Hemingway St
- 2150 Hacienda St
- 2158 Hacienda St
- 2142 Hemingway St
- 660 Chancellor Blvd
- 2177 Hacienda St
- 2129 Hacienda St
- 2136 Hacienda St
- 2172 Hemingway St
- 2136 Hemingway St
- 650 Chancellor Blvd
- 2185 Hacienda St