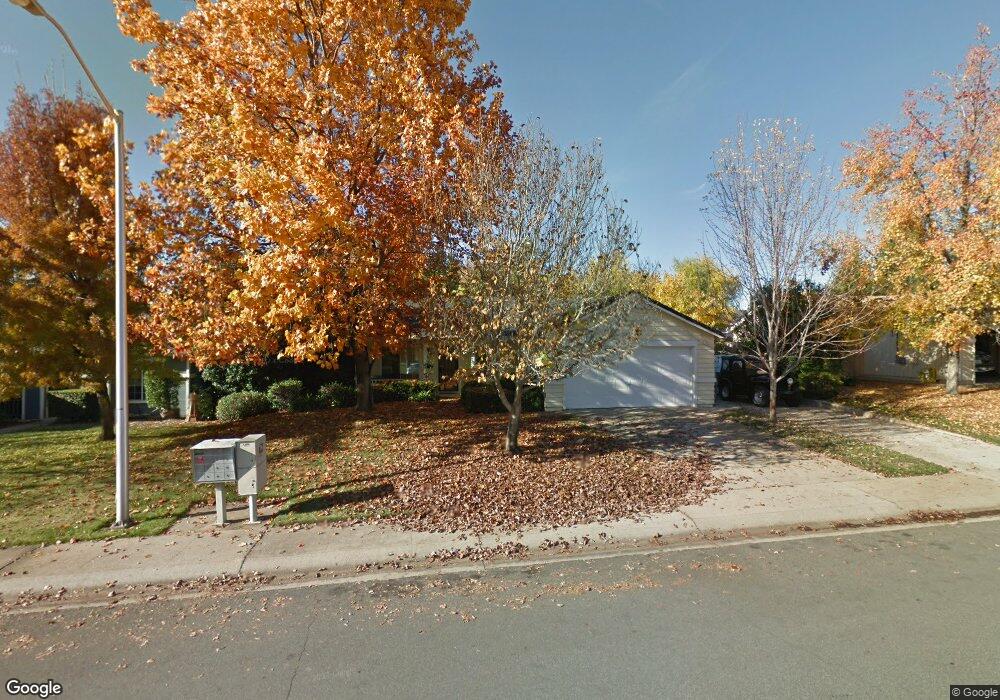
2154 Hemingway St Redding, CA 96003
Simpson University Region NeighborhoodEstimated Value: $305,649 - $361,000
3
Beds
2
Baths
1,090
Sq Ft
$310/Sq Ft
Est. Value
About This Home
This home is located at 2154 Hemingway St, Redding, CA 96003 and is currently estimated at $337,662, approximately $309 per square foot. 2154 Hemingway St is a home located in Shasta County with nearby schools including Columbia Elementary School, Mountain View Middle School, and Foothill High School.
Ownership History
Date
Name
Owned For
Owner Type
Purchase Details
Closed on
Sep 29, 2021
Sold by
Mcmaster Michael and Mcmaster Gayle
Bought by
Mcmaster Gayle
Current Estimated Value
Purchase Details
Closed on
Sep 23, 2021
Sold by
Mcmaster Gayle
Bought by
Mcmaster Gayle and Gayle Mcmaster Revocable
Purchase Details
Closed on
Aug 1, 2005
Sold by
Mcmaster Gayle K and Tolbertson Gayle K
Bought by
Mcmaster Mike E and Mcmaster Gayle K
Home Financials for this Owner
Home Financials are based on the most recent Mortgage that was taken out on this home.
Original Mortgage
$188,000
Outstanding Balance
$97,486
Interest Rate
5.46%
Mortgage Type
Stand Alone Refi Refinance Of Original Loan
Estimated Equity
$240,176
Purchase Details
Closed on
Oct 12, 2000
Sold by
Greaver Fred E and Greaver Dorothy K
Bought by
Tolbertson Gayle K
Home Financials for this Owner
Home Financials are based on the most recent Mortgage that was taken out on this home.
Original Mortgage
$65,700
Interest Rate
7.96%
Mortgage Type
Purchase Money Mortgage
Create a Home Valuation Report for This Property
The Home Valuation Report is an in-depth analysis detailing your home's value as well as a comparison with similar homes in the area
Home Values in the Area
Average Home Value in this Area
Purchase History
| Date | Buyer | Sale Price | Title Company |
|---|---|---|---|
| Mcmaster Gayle | -- | None Available | |
| Mcmaster Gayle | -- | None Available | |
| Mcmaster Mike E | -- | Alliance Title Company | |
| Tolbertson Gayle K | -- | Fidelity National Title Co |
Source: Public Records
Mortgage History
| Date | Status | Borrower | Loan Amount |
|---|---|---|---|
| Open | Mcmaster Mike E | $188,000 | |
| Closed | Tolbertson Gayle K | $65,700 |
Source: Public Records
Tax History
| Year | Tax Paid | Tax Assessment Tax Assessment Total Assessment is a certain percentage of the fair market value that is determined by local assessors to be the total taxable value of land and additions on the property. | Land | Improvement |
|---|---|---|---|---|
| 2025 | $1,963 | $169,933 | $50,970 | $118,963 |
| 2024 | $1,968 | $166,602 | $49,971 | $116,631 |
| 2023 | $1,968 | $163,337 | $48,992 | $114,345 |
| 2022 | $1,895 | $160,135 | $48,032 | $112,103 |
| 2021 | $1,805 | $156,996 | $47,091 | $109,905 |
| 2020 | $1,773 | $155,388 | $46,609 | $108,779 |
| 2019 | $1,731 | $152,343 | $45,696 | $106,647 |
| 2018 | $1,763 | $149,356 | $44,800 | $104,556 |
| 2017 | $1,780 | $146,428 | $43,922 | $102,506 |
| 2016 | $1,670 | $143,558 | $43,061 | $100,497 |
| 2015 | $1,643 | $141,403 | $42,415 | $98,988 |
| 2014 | $1,597 | $138,634 | $41,585 | $97,049 |
Source: Public Records
Map
Nearby Homes
- 550 Armando Ave
- 2182 Cadjew St
- 2134 Cadjew St
- 2110 Cadjew St
- 547 Casa Buena St
- 2199 Princeton Way
- 2192 Princeton Way
- 965 Willow Brook Ln
- 332 Franciscan Trail
- 953 Oakmont Dr
- 006 Old Oregon Trail
- 1090 Gibralter Rd
- 790 Volcano View Trail
- 61 Tidmore Ln
- 667 Reddington Dr
- 1110 Grouse Dr
- 531 Fair Hill Dr
- 1088 Burton Dr
- 10587 Quail Hollow Dr
- 1595 Sterling Dr
- 2148 Hemingway St
- 2160 Hemingway St
- 2145 Hacienda St
- 2153 Hacienda St Unit 1
- 2153 Hacienda St
- 2142 Hemingway St
- 2166 Hemingway St
- 2161 Hacienda St
- 2137 Hacienda St
- 2157 Hemingway St
- 2151 Hemingway St
- 2169 Hacienda St
- 2136 Hemingway St
- 2129 Hacienda St
- 2163 Hemingway St
- 2172 Hemingway St
- 2139 Hemingway St
- 2145 Hemingway St
- 2177 Hacienda St
- 2130 Hemingway St
Your Personal Tour Guide
Ask me questions while you tour the home.