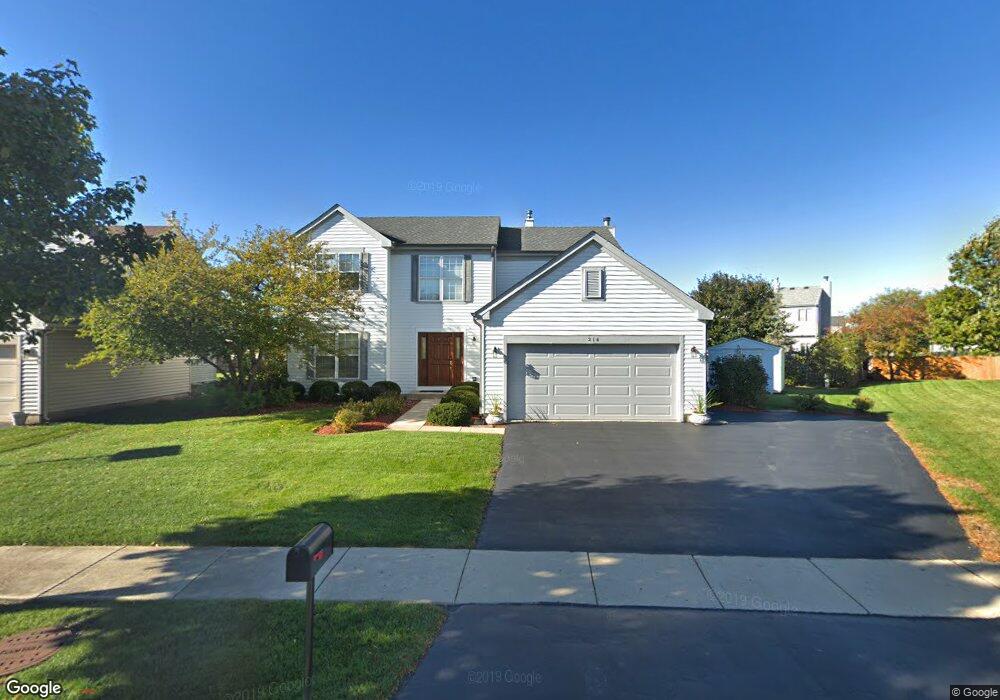
216 Carroll Way Bartlett, IL 60103
Estimated Value: $449,356 - $488,000
3
Beds
2
Baths
1,819
Sq Ft
$256/Sq Ft
Est. Value
About This Home
This home is located at 216 Carroll Way, Bartlett, IL 60103 and is currently estimated at $466,089, approximately $256 per square foot. 216 Carroll Way is a home located in Cook County with nearby schools including Nature Ridge Elementary School, Kenyon Woods Middle School, and South Elgin High School.
Ownership History
Date
Name
Owned For
Owner Type
Purchase Details
Closed on
Nov 2, 2016
Sold by
Namnick Steven Michael
Bought by
Slana Audrey Ann
Current Estimated Value
Home Financials for this Owner
Home Financials are based on the most recent Mortgage that was taken out on this home.
Original Mortgage
$165,000
Outstanding Balance
$75,607
Interest Rate
3.52%
Mortgage Type
New Conventional
Estimated Equity
$390,482
Purchase Details
Closed on
Oct 17, 2002
Sold by
Namnick Steven M and Slana Audrey A
Bought by
Namnick Steven M and Slana Audrey A
Home Financials for this Owner
Home Financials are based on the most recent Mortgage that was taken out on this home.
Original Mortgage
$174,000
Interest Rate
6.13%
Purchase Details
Closed on
Jan 4, 1996
Sold by
Centex Real Estate Corp
Bought by
Namnick Steven M and Slana Audrey A
Home Financials for this Owner
Home Financials are based on the most recent Mortgage that was taken out on this home.
Original Mortgage
$197,830
Interest Rate
7.11%
Create a Home Valuation Report for This Property
The Home Valuation Report is an in-depth analysis detailing your home's value as well as a comparison with similar homes in the area
Home Values in the Area
Average Home Value in this Area
Purchase History
| Date | Buyer | Sale Price | Title Company |
|---|---|---|---|
| Slana Audrey Ann | -- | None Available | |
| Namnick Steven M | -- | -- | |
| Namnick Steven M | $208,500 | -- |
Source: Public Records
Mortgage History
| Date | Status | Borrower | Loan Amount |
|---|---|---|---|
| Open | Slana Audrey Ann | $165,000 | |
| Previous Owner | Namnick Steven M | $174,000 | |
| Previous Owner | Namnick Steven M | $197,830 |
Source: Public Records
Tax History
| Year | Tax Paid | Tax Assessment Tax Assessment Total Assessment is a certain percentage of the fair market value that is determined by local assessors to be the total taxable value of land and additions on the property. | Land | Improvement |
|---|---|---|---|---|
| 2025 | $9,568 | $41,000 | $11,897 | $29,103 |
| 2024 | $9,568 | $33,001 | $10,113 | $22,888 |
| 2023 | $9,220 | $33,001 | $10,113 | $22,888 |
| 2022 | $9,220 | $33,001 | $10,113 | $22,888 |
| 2021 | $8,361 | $25,334 | $8,922 | $16,412 |
| 2020 | $8,323 | $25,334 | $8,922 | $16,412 |
| 2019 | $8,252 | $28,149 | $8,922 | $19,227 |
| 2018 | $8,314 | $26,254 | $7,733 | $18,521 |
| 2017 | $8,190 | $26,254 | $7,733 | $18,521 |
| 2016 | $7,943 | $26,254 | $7,733 | $18,521 |
| 2015 | $7,592 | $23,584 | $6,840 | $16,744 |
| 2014 | $7,511 | $23,584 | $6,840 | $16,744 |
| 2013 | $7,194 | $23,584 | $6,840 | $16,744 |
Source: Public Records
Map
Nearby Homes
- 220 Carroll Way
- 2068 Norwich Dr
- 1969 Osprey Ct Unit 223
- 1916 Blue Heron Cir
- 127 5th Ave
- 106 8th Ave
- 1627 Spaulding Rd Unit 524
- 485 Topaz Ln
- 995 Bluff Quarry Dr
- 529 Rose Ln
- 19 N East Ave
- 1088 Center Dr
- 720 Thornbury Rd Unit 1115
- 645 E State St
- 3 S South Elgin Blvd
- 613 Rose Ln
- 1701 Deer Pointe Dr
- 521 E Spring Ave
- 787 Thornbury Ct Unit 1041
- 1040 Moraine Dr
- 219 Cedarfield Dr Unit 2
- 223 Cedarfield Dr Unit 2
- 1999 Ridgemore Dr
- 227 Cedarfield Dr
- 1968 Westridge Blvd
- 1991 Ridgemore Dr
- 1972 Westridge Blvd
- 1962 Westridge Blvd
- 231 Cedarfield Dr
- 1976 Westridge Blvd
- 1989 Ridgemore Dr
- 1994 Ridgemore Dr
- 1958 Westridge Blvd
- 220 Cedarfield Dr
- 235 Cedarfield Dr
- 2007 Ridgemore Dr
- 1990 Ridgemore Dr
- 1998 Ridgemore Dr
- 1980 Westridge Blvd
- 228 Cedarfield Dr
Your Personal Tour Guide
Ask me questions while you tour the home.