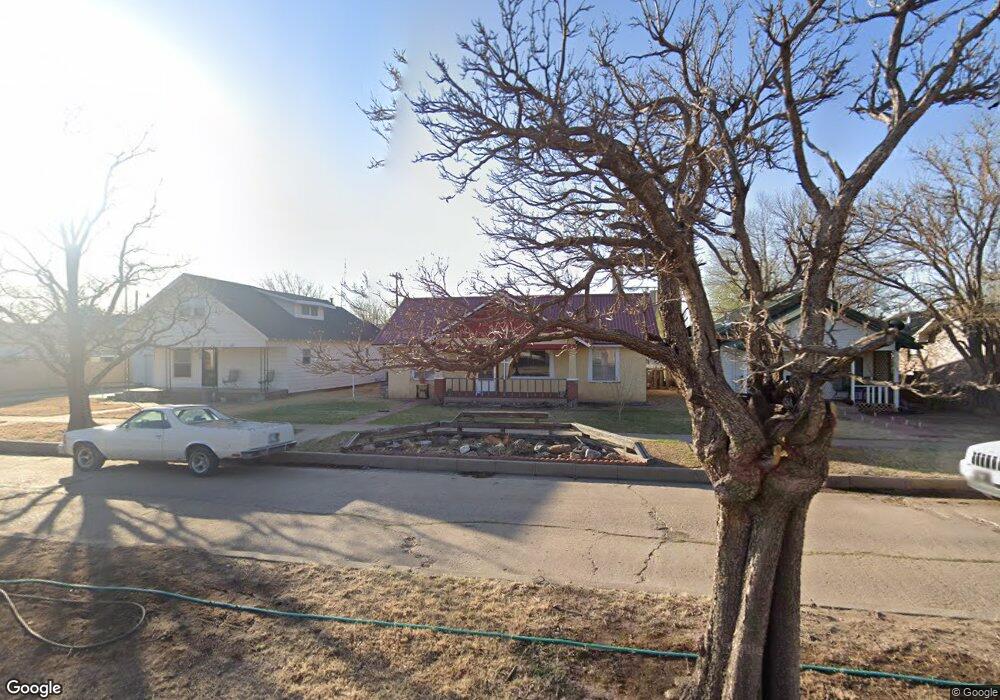
216 Imo St Hooker, OK 73945
Estimated Value: $74,634 - $154,000
2
Beds
1
Bath
1,128
Sq Ft
$105/Sq Ft
Est. Value
About This Home
This home is located at 216 Imo St, Hooker, OK 73945 and is currently estimated at $118,909, approximately $105 per square foot. 216 Imo St is a home with nearby schools including Hooker Elementary School and Hooker High School.
Ownership History
Date
Name
Owned For
Owner Type
Purchase Details
Closed on
Aug 21, 2024
Sold by
Brooks William T and Brooks Brenda
Bought by
Mcmichael Richard D
Current Estimated Value
Home Financials for this Owner
Home Financials are based on the most recent Mortgage that was taken out on this home.
Original Mortgage
$49,000
Outstanding Balance
$46,290
Interest Rate
0.56%
Mortgage Type
Construction
Estimated Equity
$72,619
Purchase Details
Closed on
Feb 3, 1995
Sold by
Atkins Dennis J and Atkins Rhonda~J
Purchase Details
Closed on
Mar 10, 1994
Sold by
Stephenson Marjorie D
Create a Home Valuation Report for This Property
The Home Valuation Report is an in-depth analysis detailing your home's value as well as a comparison with similar homes in the area
Purchase History
| Date | Buyer | Sale Price | Title Company |
|---|---|---|---|
| Mcmichael Richard D | $50,000 | -- | |
| -- | $20,000 | -- | |
| -- | $20,000 | -- |
Source: Public Records
Mortgage History
| Date | Status | Borrower | Loan Amount |
|---|---|---|---|
| Open | Mcmichael Richard D | $49,000 |
Source: Public Records
Tax History
| Year | Tax Paid | Tax Assessment Tax Assessment Total Assessment is a certain percentage of the fair market value that is determined by local assessors to be the total taxable value of land and additions on the property. | Land | Improvement |
|---|---|---|---|---|
| 2025 | $254 | $5,435 | $550 | $4,885 |
| 2024 | $236 | $5,123 | $519 | $4,604 |
| 2023 | $228 | $4,974 | $496 | $4,478 |
| 2022 | $236 | $4,829 | $463 | $4,366 |
| 2021 | $228 | $4,829 | $463 | $4,366 |
| 2020 | $219 | $4,552 | $400 | $4,152 |
| 2019 | $214 | $4,420 | $400 | $4,020 |
| 2018 | $207 | $4,291 | $400 | $3,891 |
| 2017 | $182 | $4,166 | $400 | $3,766 |
| 2016 | $169 | $3,927 | $400 | $3,527 |
| 2015 | -- | $3,927 | $400 | $3,527 |
| 2014 | -- | $3,927 | $400 | $3,527 |
Source: Public Records
Map
Nearby Homes
- 201 Glaydas St Unit aka Main Street
- 212 Lorenz St
- 206 N Memorial
- 706 W Park
- Sect 27, TS 6 NW Nr 16
- 0 Mile 44 Rd Unit 20968945
- 4733 Road E
- 3012 Road S
- 808 E Indiana
- 604 Indiana St
- 422 Blackmer St
- 3076 Road P
- Lots 19 Rimrock
- 901 O Hwy N Hwy 54
- 412 & 207 E Hwy 207 & Hwy 412
- 09-02N-16E S E Mile 39
- 01-02N-15E S1/2 E Mile 35
- 6263 Meadows Ln
- 507 5th St
- 0 Road X
Your Personal Tour Guide
Ask me questions while you tour the home.