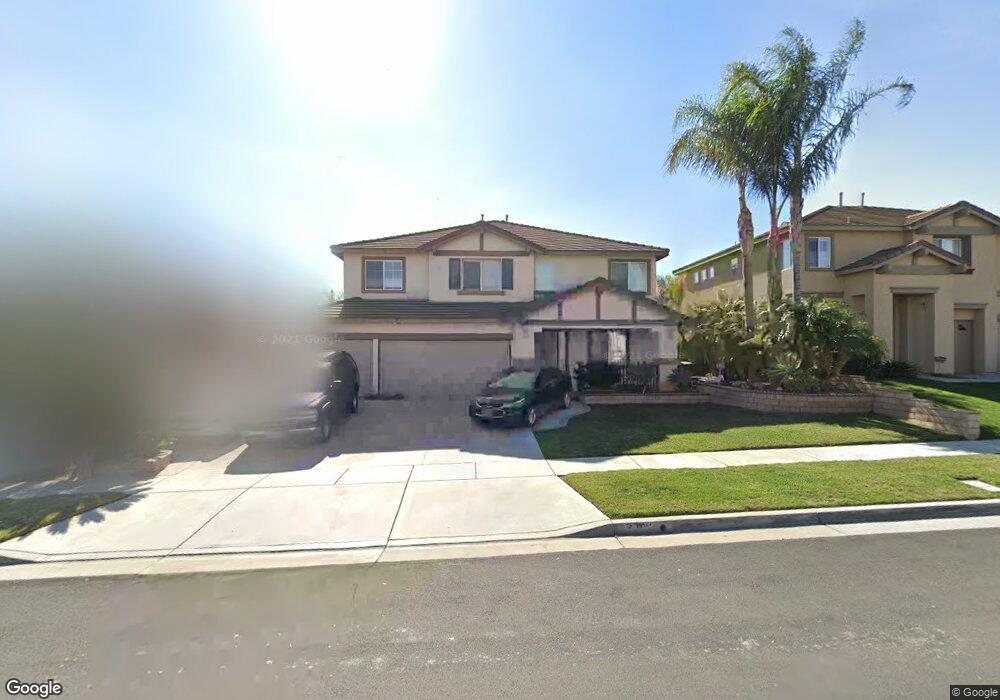
2160 Whitman Way Corona, CA 92880
North Corona NeighborhoodEstimated Value: $919,574 - $1,020,000
5
Beds
3
Baths
3,032
Sq Ft
$321/Sq Ft
Est. Value
About This Home
This home is located at 2160 Whitman Way, Corona, CA 92880 and is currently estimated at $973,644, approximately $321 per square foot. 2160 Whitman Way is a home located in Riverside County with nearby schools including George Washington Elementary, Auburndale Intermediate, and Norco High School.
Ownership History
Date
Name
Owned For
Owner Type
Purchase Details
Closed on
Dec 13, 2011
Sold by
Barbarian Agop and Barbarian Margarit
Bought by
Barbarian Harout
Current Estimated Value
Purchase Details
Closed on
Jun 16, 2004
Sold by
Russell Larry and Russell Judy
Bought by
Barbarian Agop and Barbarian Margarit
Purchase Details
Closed on
Dec 7, 1998
Sold by
Wh Corona Associates Lp
Bought by
Russell Larry and Russell Judy Lee
Home Financials for this Owner
Home Financials are based on the most recent Mortgage that was taken out on this home.
Original Mortgage
$209,608
Interest Rate
6.82%
Mortgage Type
Purchase Money Mortgage
Create a Home Valuation Report for This Property
The Home Valuation Report is an in-depth analysis detailing your home's value as well as a comparison with similar homes in the area
Home Values in the Area
Average Home Value in this Area
Purchase History
| Date | Buyer | Sale Price | Title Company |
|---|---|---|---|
| Barbarian Harout | -- | None Available | |
| Barbarian Agop | $550,000 | Fidelity National Title Ins | |
| Russell Larry | $221,000 | Chicago Title Co |
Source: Public Records
Mortgage History
| Date | Status | Borrower | Loan Amount |
|---|---|---|---|
| Previous Owner | Russell Larry | $209,608 |
Source: Public Records
Tax History Compared to Growth
Tax History
| Year | Tax Paid | Tax Assessment Tax Assessment Total Assessment is a certain percentage of the fair market value that is determined by local assessors to be the total taxable value of land and additions on the property. | Land | Improvement |
|---|---|---|---|---|
| 2025 | $6,480 | $498,635 | $113,037 | $385,598 |
| 2023 | $6,480 | $479,275 | $108,649 | $370,626 |
| 2022 | $6,265 | $469,878 | $106,519 | $363,359 |
| 2021 | $6,140 | $460,666 | $104,431 | $356,235 |
| 2020 | $6,047 | $455,944 | $103,361 | $352,583 |
| 2019 | $5,910 | $447,005 | $101,335 | $345,670 |
| 2018 | $5,779 | $438,242 | $99,349 | $338,893 |
| 2017 | $5,640 | $429,650 | $97,401 | $332,249 |
| 2016 | $5,685 | $421,227 | $95,492 | $325,735 |
| 2015 | $5,504 | $414,902 | $94,058 | $320,844 |
| 2014 | $5,346 | $406,776 | $92,216 | $314,560 |
Source: Public Records
Map
Nearby Homes
- 2151 Bowdoin St
- 938 Amherst St
- 1841 Chesapeake Way
- 1826 Chesapeake Way
- 1868 Kingsford Dr
- 4931 Roundup Rd
- 921 Hedges Dr
- 911 Homestead Rd
- 4921 Bluff St
- 2344 Santa Anita Rd
- 2374 Corydon Ave
- 1142 Country Club Ln
- 1530 Greenbriar Ave
- 1474 Greenbriar Ave
- 4047 Bluff St
- 1966 Trotter Trail
- 3344 Dales Dr
- 936 Auburndale St
- 3527 Bluff St
- 2888 Corydon Ave
- 2170 Whitman Way
- 2141 Shelley Cir
- 2140 Whitman Way
- 2180 Whitman Way
- 2151 Shelley Cir
- 979 Hemingway Dr
- 2163 Whitman Way
- 2151 Whitman Way
- 975 Hemingway Dr
- 2130 Whitman Way
- 2175 Whitman Way
- 2131 Shelley Cir
- 2139 Whitman Way
- 2187 Whitman Way
- 971 Hemingway Dr
- 2193 Whitman Way
- 2120 Whitman Way
- 2127 Whitman Way
- 2121 Shelley Cir
- 2148 Shelley Cir