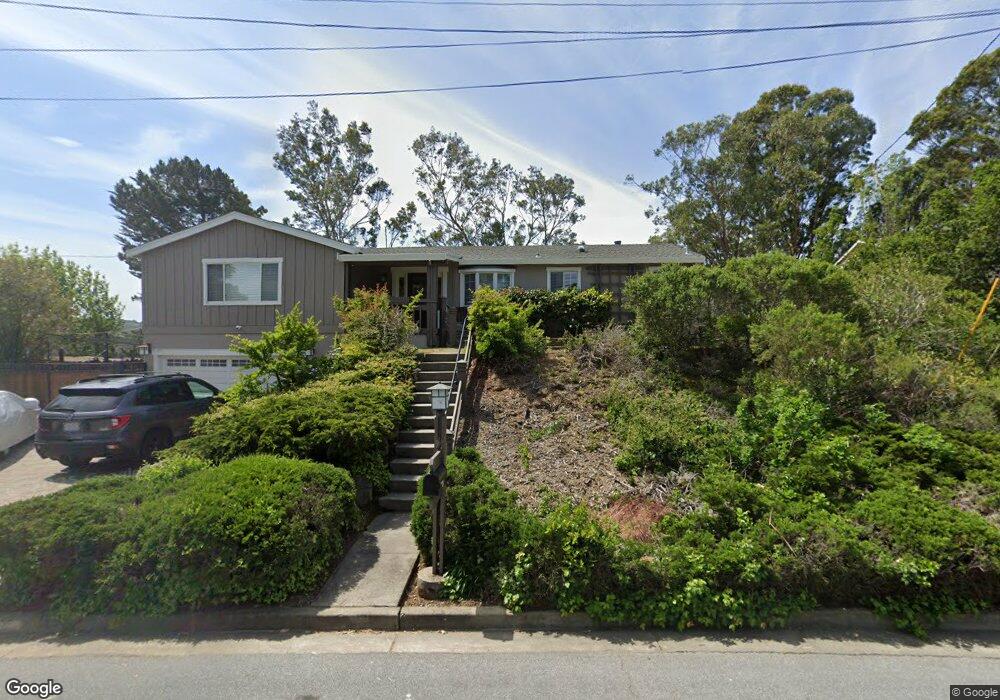
2165 Queens Ln San Mateo, CA 94402
Baywood Park NeighborhoodEstimated Value: $2,498,000 - $3,245,887
4
Beds
4
Baths
2,640
Sq Ft
$1,059/Sq Ft
Est. Value
About This Home
This home is located at 2165 Queens Ln, San Mateo, CA 94402 and is currently estimated at $2,795,472, approximately $1,058 per square foot. 2165 Queens Ln is a home located in San Mateo County with nearby schools including Highlands Elementary School, Borel Middle School, and Aragon High School.
Ownership History
Date
Name
Owned For
Owner Type
Purchase Details
Closed on
Nov 17, 2005
Sold by
Horita Glenn N and Hong Christina G
Bought by
Horita Glenn and Hong Christina
Current Estimated Value
Purchase Details
Closed on
Dec 2, 2002
Sold by
Fay Natalie Antoinette and Hedlund Stieg Brian
Bought by
Horita Glenn N and Hong Christina G
Home Financials for this Owner
Home Financials are based on the most recent Mortgage that was taken out on this home.
Original Mortgage
$450,000
Outstanding Balance
$188,529
Interest Rate
6.28%
Estimated Equity
$2,606,943
Purchase Details
Closed on
Sep 27, 1996
Sold by
Noce John L and Noce Kathryn F
Bought by
Hedland Stieg Brian and Fay Natalie Antoinette
Home Financials for this Owner
Home Financials are based on the most recent Mortgage that was taken out on this home.
Original Mortgage
$207,000
Interest Rate
7.95%
Create a Home Valuation Report for This Property
The Home Valuation Report is an in-depth analysis detailing your home's value as well as a comparison with similar homes in the area
Home Values in the Area
Average Home Value in this Area
Purchase History
| Date | Buyer | Sale Price | Title Company |
|---|---|---|---|
| Horita Glenn | -- | -- | |
| Horita Glenn N | $1,180,000 | North American Title Company | |
| Hedland Stieg Brian | $460,000 | Commonwealth Land Title Co |
Source: Public Records
Mortgage History
| Date | Status | Borrower | Loan Amount |
|---|---|---|---|
| Open | Horita Glenn N | $450,000 | |
| Previous Owner | Hedland Stieg Brian | $207,000 |
Source: Public Records
Tax History
| Year | Tax Paid | Tax Assessment Tax Assessment Total Assessment is a certain percentage of the fair market value that is determined by local assessors to be the total taxable value of land and additions on the property. | Land | Improvement |
|---|---|---|---|---|
| 2025 | $21,196 | $1,709,020 | $854,510 | $854,510 |
| 2023 | $21,196 | $1,642,658 | $821,329 | $821,329 |
| 2022 | $20,422 | $1,610,450 | $805,225 | $805,225 |
| 2021 | $20,073 | $1,578,874 | $789,437 | $789,437 |
| 2020 | $19,403 | $1,562,686 | $781,343 | $781,343 |
| 2019 | $18,897 | $1,532,046 | $766,023 | $766,023 |
| 2018 | $18,227 | $1,502,006 | $751,003 | $751,003 |
| 2017 | $17,975 | $1,472,556 | $736,278 | $736,278 |
| 2016 | $17,842 | $1,443,684 | $721,842 | $721,842 |
| 2015 | $17,462 | $1,422,000 | $711,000 | $711,000 |
| 2014 | $17,054 | $1,394,146 | $697,073 | $697,073 |
Source: Public Records
Map
Nearby Homes
- 2056 Fairmont Dr
- 117 Lakewood Cir
- 3528 Broadview Ct
- 15 Amy Dr
- 3900-A Marsten Ave
- 1521 Cherrywood Dr
- 0 Ralston Ave Unit ML81985419
- 4112 Marsten Ave
- 3900 Marsten Ave
- 3400 Douglas Ct
- 3860 W Naughton Ave
- 6 Havenridge Ct
- 0 Lower Lock Ave
- 2758 Belmont Canyon Rd
- 0 W Naughton Ave
- 2741 Belmont Canyon Rd
- 42 Lyonridge Ln
- 1581 Ascension Dr
- 0 Bartlett Way Unit ML82003351
- 3311 Plateau Dr
- 2159 Queens Ln
- 2177 Queens Ln
- 2166 Queens Ln
- 2153 Queens Ln
- 2178 Queens Ln
- 2154 Queens Ln
- 2183 Queens Ln
- 29 Lakewood Cir
- 2084 Kings Ln
- 33 Lakewood Cir
- 2078 Kings Ln
- 2147 Queens Ln
- 2184 Queens Ln
- 25 Lakewood Cir
- 37 Lakewood Cir
- 2189 Queens Ln
- 2072 Kings Ln
- 2142 Queens Ln
- 2089 Kings Ln
- 41 Lakewood Cir
Your Personal Tour Guide
Ask me questions while you tour the home.