217 Hedge Dr Springfield, OH 45504
Cedar Hills/Broadview NeighborhoodEstimated Value: $246,000 - $296,000
3
Beds
3
Baths
1,624
Sq Ft
$166/Sq Ft
Est. Value
About This Home
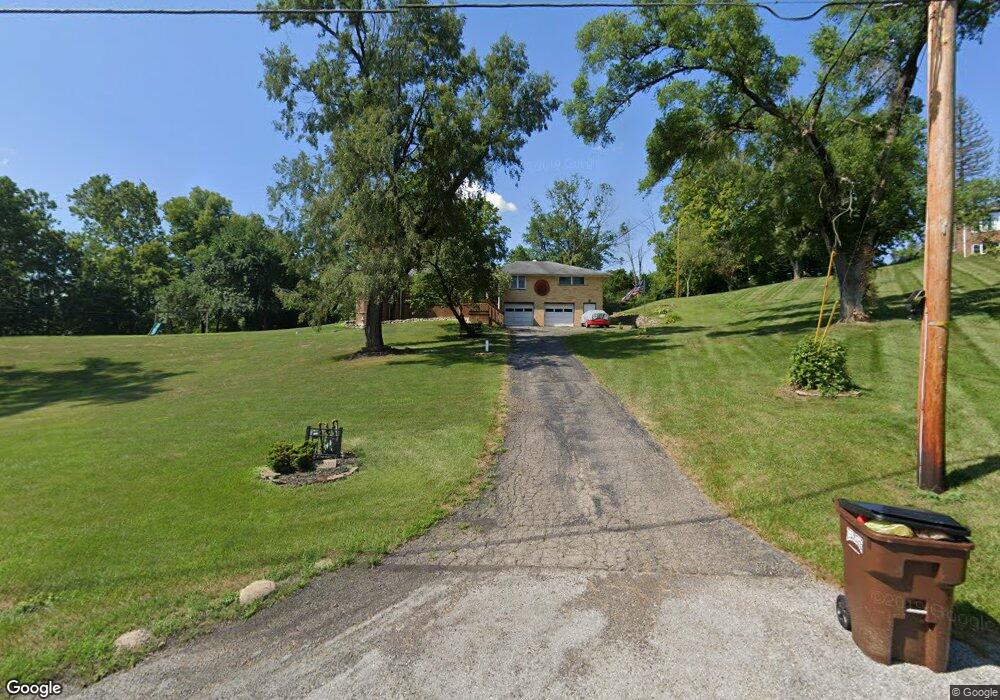
This home is located at 217 Hedge Dr, Springfield, OH 45504 and is currently estimated at $269,550, approximately $165 per square foot. 217 Hedge Dr is a home located in Clark County with nearby schools including Possum Elementary School, Shawnee Middle School/High School, and Springfield Christian School.
Ownership History
Date
Name
Owned For
Owner Type
Purchase Details
Closed on
Jul 25, 1995
Sold by
Davis Betty L
Bought by
Barnes Gary C and Barnes Cynthia
Current Estimated Value
Home Financials for this Owner
Home Financials are based on the most recent Mortgage that was taken out on this home.
Original Mortgage
$50,000
Interest Rate
7.5%
Mortgage Type
New Conventional
Purchase Details
Closed on
May 3, 1991
Create a Home Valuation Report for This Property
The Home Valuation Report is an in-depth analysis detailing your home's value as well as a comparison with similar homes in the area
Home Values in the Area
Average Home Value in this Area
Purchase History
| Date | Buyer | Sale Price | Title Company |
|---|---|---|---|
| Barnes Gary C | $99,900 | -- | |
| -- | -- | -- |
Source: Public Records
Mortgage History
| Date | Status | Borrower | Loan Amount |
|---|---|---|---|
| Closed | Barnes Gary C | $50,000 |
Source: Public Records
Tax History
| Year | Tax Paid | Tax Assessment Tax Assessment Total Assessment is a certain percentage of the fair market value that is determined by local assessors to be the total taxable value of land and additions on the property. | Land | Improvement |
|---|---|---|---|---|
| 2025 | $3,180 | $77,150 | $14,700 | $62,450 |
| 2024 | $3,097 | $63,410 | $10,840 | $52,570 |
| 2023 | $3,097 | $63,410 | $10,840 | $52,570 |
| 2022 | $3,072 | $63,410 | $10,840 | $52,570 |
| 2021 | $2,659 | $49,150 | $8,400 | $40,750 |
| 2020 | $2,681 | $49,150 | $8,400 | $40,750 |
| 2019 | $2,724 | $49,150 | $8,400 | $40,750 |
| 2018 | $2,277 | $40,540 | $7,640 | $32,900 |
| 2017 | $2,334 | $40,541 | $7,637 | $32,904 |
| 2016 | $2,105 | $40,541 | $7,637 | $32,904 |
| 2015 | $2,079 | $38,696 | $7,637 | $31,059 |
| 2014 | $2,085 | $38,696 | $7,637 | $31,059 |
| 2013 | $1,811 | $38,696 | $7,637 | $31,059 |
Source: Public Records
Map
Nearby Homes
- 190 Oakridge Dr
- 0 Upper Valley Pike
- 2805 Cottonwood Dr
- 2743 Ironwood Dr
- 624 Aberfelda Dr
- 124 Old Mill Rd
- 2162 Broadway St
- 925 Upper Valley Pike
- 917 White Oak Dr
- 3267 Lower Valley Pike Unit Tract 2
- 106 Walter St
- 3819 New Carlisle Pike
- 2705 Ash Dr
- 1915 W Washington St
- 1866 Maiden Ln
- 1828 W Washington St
- 80 Carlisle Ave
- 780 W Eva Cir
- 3319 Wendover St
- 1524 W North St Unit 1526
Your Personal Tour Guide
Ask me questions while you tour the home.