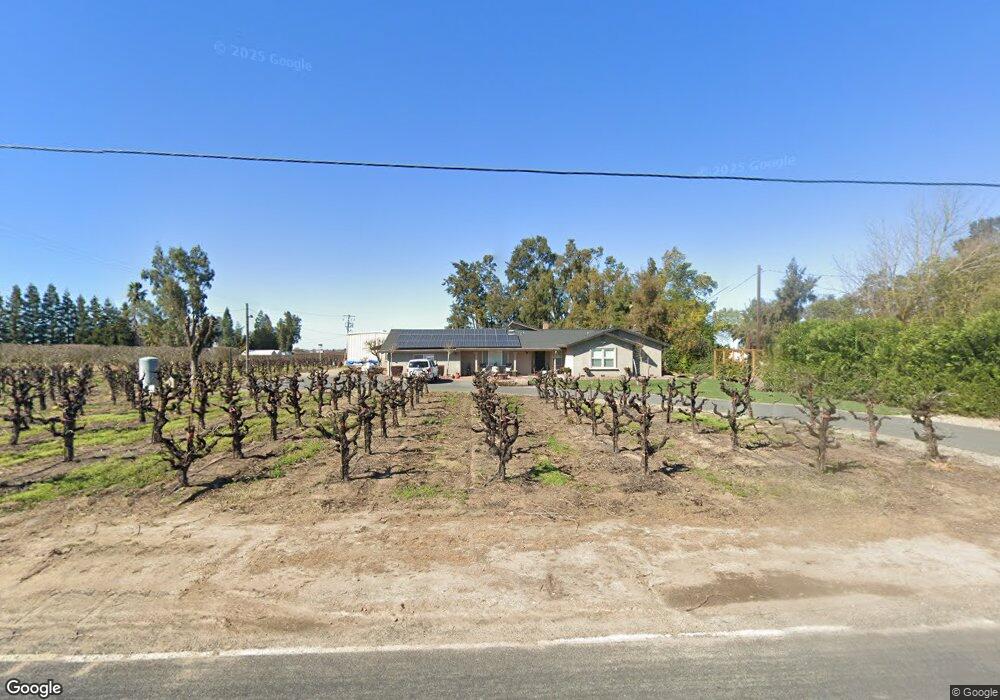
21709 N Des Moines Rd Acampo, CA 95220
Estimated Value: $696,000 - $999,254
4
Beds
2
Baths
2,312
Sq Ft
$353/Sq Ft
Est. Value
About This Home
This home is located at 21709 N Des Moines Rd, Acampo, CA 95220 and is currently estimated at $815,314, approximately $352 per square foot. 21709 N Des Moines Rd is a home located in San Joaquin County with nearby schools including Houston School, Lodi High School, and St. Anne Elementary School.
Ownership History
Date
Name
Owned For
Owner Type
Purchase Details
Closed on
Oct 17, 2001
Sold by
Mcconahey Paul L and Mcconahey Roberta E
Bought by
Mcconahey Paul L and Mcconahey Roberta E
Current Estimated Value
Purchase Details
Closed on
Jul 24, 1997
Sold by
George Fred W and George Claire
Bought by
George Fred W and George Claire P
Create a Home Valuation Report for This Property
The Home Valuation Report is an in-depth analysis detailing your home's value as well as a comparison with similar homes in the area
Home Values in the Area
Average Home Value in this Area
Purchase History
| Date | Buyer | Sale Price | Title Company |
|---|---|---|---|
| Mcconahey Paul L | -- | Chicago Title Co | |
| George Fred W | -- | -- |
Source: Public Records
Tax History Compared to Growth
Tax History
| Year | Tax Paid | Tax Assessment Tax Assessment Total Assessment is a certain percentage of the fair market value that is determined by local assessors to be the total taxable value of land and additions on the property. | Land | Improvement |
|---|---|---|---|---|
| 2025 | $6,774 | $603,337 | $258,512 | $344,825 |
| 2024 | $6,596 | $591,508 | $253,444 | $338,064 |
| 2023 | $6,452 | $579,911 | $248,475 | $331,436 |
| 2022 | $6,060 | $538,541 | $243,603 | $294,938 |
| 2021 | $6,162 | $527,982 | $238,827 | $289,155 |
| 2020 | $5,715 | $522,570 | $236,379 | $286,191 |
| 2019 | $5,598 | $512,325 | $231,745 | $280,580 |
| 2018 | $5,519 | $502,280 | $227,201 | $275,079 |
| 2017 | $5,394 | $492,433 | $222,747 | $269,686 |
| 2016 | $5,055 | $482,781 | $218,381 | $264,400 |
| 2014 | $4,925 | $466,219 | $210,889 | $255,330 |
Source: Public Records
Map
Nearby Homes
- 21649 N Des Moines Rd
- 0 N Sycamore Rd
- 20388 N State Route 99 E Fron
- 19690 California 99 Unit 121
- 19690 California 99 Unit 27
- 19450 Hidden Lakes Ln
- 19690 N Highway 99 Unit 26
- 19690 N Highway 99 Unit 24
- 19690 N Highway 99 Unit 66
- 19690 N Highway 99 Unit 8
- 19690 N Highway 99 Unit 162
- 5420 E Jahant Rd
- 6539 E Peltier Rd
- 5860 E Jahant Rd
- 19250 N Lower Sacramento Rd Unit 4
- 19250 N Lower Sacramento Rd Unit 25
- 1744 Wyn Way
- 1605 Edgewood Dr
- 1132 Rivergate Dr Unit 13
- 1786 Le Bec Ct
- 21753 N Des Moines Rd
- 21679 N Des Moines Rd
- 21471 N Des Moines Rd
- 21355 N Des Moines Rd
- 21161 N Des Moines Rd
- 3711 E Acampo Rd
- 4121 E Acampo Rd
- 3434 E Peltier Rd
- 3650 E Acampo Rd
- 3283 E Acampo Rd
- 3376 E Acampo Rd
- 3348 E Acampo Rd
- 3326 E Acampo Rd
- 22355 N Highway 99
- 3252 E Acampo Rd
- 3358 E Acampo Rd
- 3813 E Peltier Rd
- 3308 E Acampo Rd
- 3105 E Acampo Rd
- 3091 E Acampo Rd