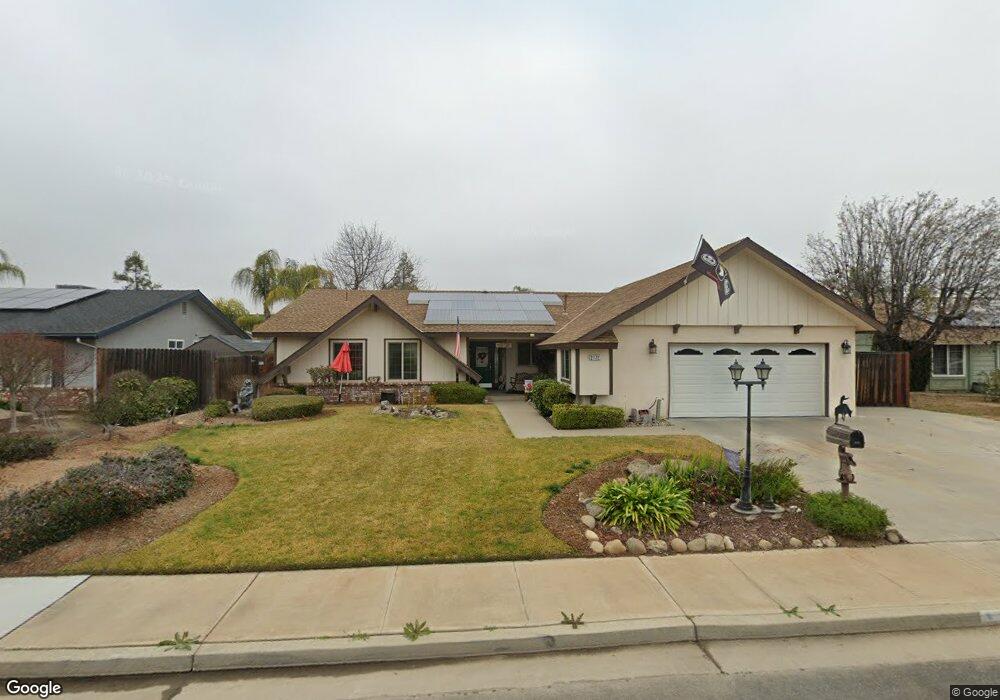
2172 Sequoia Ave Sanger, CA 93657
Estimated Value: $369,933 - $437,000
3
Beds
2
Baths
1,516
Sq Ft
$264/Sq Ft
Est. Value
About This Home
This home is located at 2172 Sequoia Ave, Sanger, CA 93657 and is currently estimated at $400,311, approximately $264 per square foot. 2172 Sequoia Ave is a home located in Fresno County with nearby schools including Jackson Elementary School, Washington Academic Middle School, and Sanger High School.
Ownership History
Date
Name
Owned For
Owner Type
Purchase Details
Closed on
Dec 26, 2023
Sold by
Puga Max J and Puga Kathleen D
Bought by
Puga Family Trust and Puga
Current Estimated Value
Purchase Details
Closed on
Apr 24, 2017
Sold by
Puga Max J
Bought by
Puga Max J and Puga Kathleen D
Home Financials for this Owner
Home Financials are based on the most recent Mortgage that was taken out on this home.
Original Mortgage
$195,000
Interest Rate
4.3%
Mortgage Type
VA
Purchase Details
Closed on
Sep 20, 2004
Sold by
Puga Max J and Puga Irma Noelia
Bought by
Puga Max J
Home Financials for this Owner
Home Financials are based on the most recent Mortgage that was taken out on this home.
Original Mortgage
$11,470
Interest Rate
5.8%
Mortgage Type
New Conventional
Purchase Details
Closed on
Feb 27, 2004
Sold by
Va
Bought by
Puga Max Joe and Puga Irma Noelia
Create a Home Valuation Report for This Property
The Home Valuation Report is an in-depth analysis detailing your home's value as well as a comparison with similar homes in the area
Home Values in the Area
Average Home Value in this Area
Purchase History
| Date | Buyer | Sale Price | Title Company |
|---|---|---|---|
| Puga Family Trust | -- | None Listed On Document | |
| Puga Max J | -- | American Coast Title Foothil | |
| Puga Max J | -- | Stewart Title Of Fresno | |
| Puga Max Joe | -- | -- |
Source: Public Records
Mortgage History
| Date | Status | Borrower | Loan Amount |
|---|---|---|---|
| Previous Owner | Puga Max J | $195,000 | |
| Previous Owner | Puga Max J | $11,470 |
Source: Public Records
Tax History
| Year | Tax Paid | Tax Assessment Tax Assessment Total Assessment is a certain percentage of the fair market value that is determined by local assessors to be the total taxable value of land and additions on the property. | Land | Improvement |
|---|---|---|---|---|
| 2025 | $2,842 | $223,592 | $47,966 | $175,626 |
| 2023 | $2,661 | $214,911 | $46,104 | $168,807 |
| 2022 | $2,621 | $210,698 | $45,200 | $165,498 |
| 2021 | $2,600 | $206,567 | $44,314 | $162,253 |
| 2020 | $2,524 | $204,450 | $43,860 | $160,590 |
| 2019 | $2,473 | $200,442 | $43,000 | $157,442 |
| 2018 | $2,370 | $196,512 | $42,157 | $154,355 |
| 2017 | $2,246 | $192,660 | $41,331 | $151,329 |
| 2016 | $2,110 | $188,883 | $40,521 | $148,362 |
| 2015 | $1,684 | $148,300 | $30,500 | $117,800 |
| 2014 | $1,583 | $138,900 | $28,600 | $110,300 |
Source: Public Records
Map
Nearby Homes
- 45 Lyon Ave
- 2125 Holt Ave
- 238 Fairbanks Ave
- 2160 3rd St
- 2563 Langport Ave Unit BH 33
- 85 Acacia Dr
- 428 Greenwood Ave
- 53 Dalton Ave
- 521 O St
- 836 S Academy Ave
- 371 Bethel Ave Unit 74
- 371 Bethel Ave Unit 59
- 371 Bethel Ave
- 371 Bethel Ave Unit 24
- 371 Bethel Ave Unit 102
- 371 Bethel Ave Unit 88
- 371 Bethel Ave Unit 27
- 1745 N Bethel Ave
- 426 L St
- 805 Lyon Ave
- 2160 Sequoia Ave
- 2182 Sequoia Ave
- 2169 Florence Ave
- 2181 Florence Ave
- 2159 Florence Ave
- 2148 Sequoia Ave
- 2194 Sequoia Ave
- 2191 Florence Ave
- 2175 Sequoia Ave
- 2163 Sequoia Ave
- 2147 Florence Ave
- 2187 Sequoia Ave
- 2151 Sequoia Ave
- 2138 Sequoia Ave
- 2206 Sequoia Ave
- 2203 Florence Ave
- 2135 Florence Ave
- 2199 Sequoia Ave
- 2170 Florence Ave
- 2139 Sequoia Ave
Your Personal Tour Guide
Ask me questions while you tour the home.