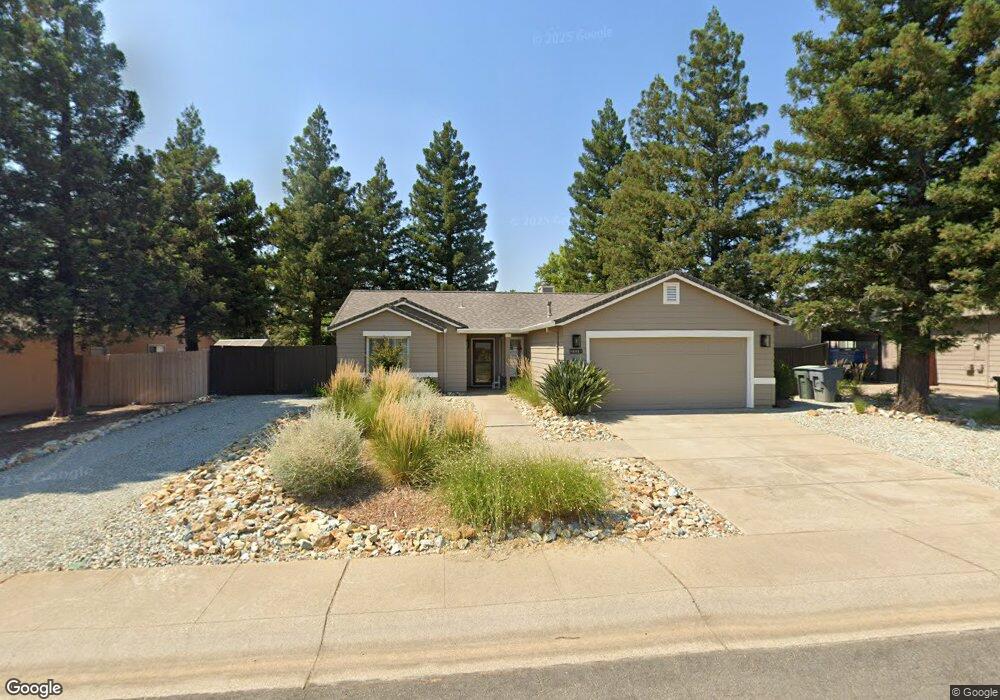
2178 Hemingway St Unit 1 Redding, CA 96003
Simpson University Region NeighborhoodEstimated Value: $412,359 - $484,000
3
Beds
2
Baths
1,520
Sq Ft
$286/Sq Ft
Est. Value
About This Home
This home is located at 2178 Hemingway St Unit 1, Redding, CA 96003 and is currently estimated at $434,340, approximately $285 per square foot. 2178 Hemingway St Unit 1 is a home located in Shasta County with nearby schools including Columbia Elementary School, Mountain View Middle School, and Foothill High School.
Ownership History
Date
Name
Owned For
Owner Type
Purchase Details
Closed on
Feb 17, 2021
Sold by
Benfield Sandra L and Sandra L Benfield Revocable Tr
Bought by
Jones Jason and Jones Shelby R
Current Estimated Value
Home Financials for this Owner
Home Financials are based on the most recent Mortgage that was taken out on this home.
Original Mortgage
$290,400
Outstanding Balance
$259,506
Interest Rate
2.65%
Mortgage Type
New Conventional
Estimated Equity
$174,834
Purchase Details
Closed on
May 12, 2017
Sold by
Nickel Robin L and Nickel Kelly B
Bought by
Benfield Sandra L
Purchase Details
Closed on
Mar 12, 1999
Sold by
Tobias Steven R and Tobias Lynda C
Bought by
Nickel Robin L and Nickel Kelly B
Home Financials for this Owner
Home Financials are based on the most recent Mortgage that was taken out on this home.
Original Mortgage
$128,505
Interest Rate
6.73%
Mortgage Type
FHA
Create a Home Valuation Report for This Property
The Home Valuation Report is an in-depth analysis detailing your home's value as well as a comparison with similar homes in the area
Home Values in the Area
Average Home Value in this Area
Purchase History
| Date | Buyer | Sale Price | Title Company |
|---|---|---|---|
| Jones Jason | $363,000 | Fidelity Natl Ttl Co Of Ca | |
| Benfield Sandra L | $277,500 | Placer Title Company | |
| Nickel Robin L | $130,000 | Fidelity National Title Co |
Source: Public Records
Mortgage History
| Date | Status | Borrower | Loan Amount |
|---|---|---|---|
| Open | Jones Jason | $290,400 | |
| Previous Owner | Nickel Robin L | $128,505 |
Source: Public Records
Tax History
| Year | Tax Paid | Tax Assessment Tax Assessment Total Assessment is a certain percentage of the fair market value that is determined by local assessors to be the total taxable value of land and additions on the property. | Land | Improvement |
|---|---|---|---|---|
| 2025 | $4,294 | $392,920 | $64,945 | $327,975 |
| 2024 | $4,310 | $385,217 | $63,672 | $321,545 |
| 2023 | $4,310 | $377,665 | $62,424 | $315,241 |
| 2022 | $4,157 | $370,260 | $61,200 | $309,060 |
| 2021 | $3,353 | $297,534 | $58,970 | $238,564 |
| 2020 | $3,308 | $294,484 | $58,366 | $236,118 |
| 2019 | $3,230 | $288,711 | $57,222 | $231,489 |
| 2018 | $3,273 | $283,050 | $56,100 | $226,950 |
| 2017 | $2,098 | $175,591 | $40,517 | $135,074 |
| 2016 | $1,967 | $172,149 | $39,723 | $132,426 |
| 2015 | $1,935 | $169,564 | $39,127 | $130,437 |
| 2014 | $1,882 | $166,243 | $38,361 | $127,882 |
Source: Public Records
Map
Nearby Homes
- 550 Armando Ave
- 2182 Cadjew St
- 2134 Cadjew St
- 2110 Cadjew St
- 547 Casa Buena St
- 2199 Princeton Way
- 2192 Princeton Way
- 965 Willow Brook Ln
- 332 Franciscan Trail
- 953 Oakmont Dr
- 006 Old Oregon Trail
- 1090 Gibralter Rd
- 790 Volcano View Trail
- 61 Tidmore Ln
- 667 Reddington Dr
- 1110 Grouse Dr
- 10587 Quail Hollow Dr
- 1088 Burton Dr
- 531 Fair Hill Dr
- 1595 Sterling Dr
- 2178 Hemingway St
- 2172 Hemingway St
- 2184 Hemingway St
- 2185 Hacienda St
- 2193 Hacienda St
- 2177 Hacienda St
- 2166 Hemingway St
- 2196 Hemingway St
- 2175 Hemingway St
- 2169 Hemingway St
- 588 Armando Ave
- 2169 Hacienda St
- 2181 Hemingway St
- 2163 Hemingway St
- 2160 Hemingway St
- 2197 Hemingway St
- 2161 Hacienda St
- 2157 Hemingway St
- 663 Chancellor Blvd
- 582 Armando Ave
Your Personal Tour Guide
Ask me questions while you tour the home.