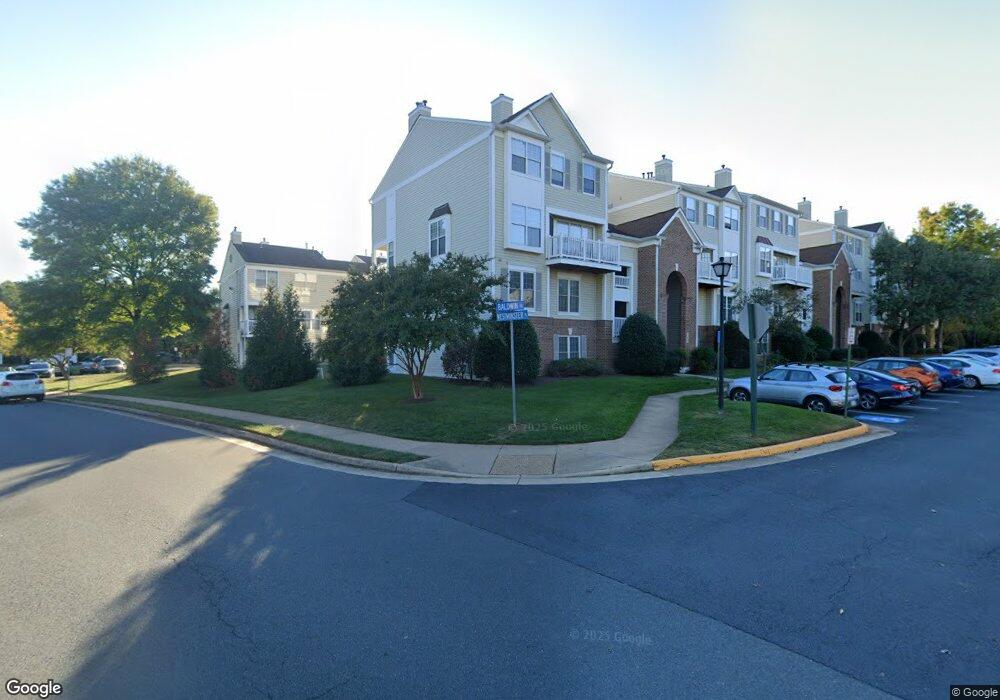
21845 Baldwin Square Unit 100 Sterling, VA 20164
Estimated Value: $371,000 - $402,000
2
Beds
2
Baths
1,082
Sq Ft
$351/Sq Ft
Est. Value
About This Home
This home is located at 21845 Baldwin Square Unit 100, Sterling, VA 20164 and is currently estimated at $380,290, approximately $351 per square foot. 21845 Baldwin Square Unit 100 is a home located in Loudoun County with nearby schools including Rolling Ridge Elementary School, Sterling Middle School, and Park View High School.
Ownership History
Date
Name
Owned For
Owner Type
Purchase Details
Closed on
Feb 13, 2019
Sold by
Ben Mergi Ofer
Bought by
Hila Ben Mergi Ofer and Hila Ben Mergi
Current Estimated Value
Purchase Details
Closed on
Apr 13, 2010
Sold by
Vasquez Daniel
Bought by
Ben Mergi Ofer
Home Financials for this Owner
Home Financials are based on the most recent Mortgage that was taken out on this home.
Original Mortgage
$124,000
Outstanding Balance
$82,547
Interest Rate
4.99%
Mortgage Type
New Conventional
Estimated Equity
$297,743
Purchase Details
Closed on
Nov 8, 2002
Sold by
Parrella Domenick
Bought by
Vasquez Daniel
Home Financials for this Owner
Home Financials are based on the most recent Mortgage that was taken out on this home.
Original Mortgage
$161,990
Interest Rate
6.09%
Mortgage Type
FHA
Purchase Details
Closed on
Oct 3, 1994
Sold by
Pulte Home
Bought by
Parrella D A
Create a Home Valuation Report for This Property
The Home Valuation Report is an in-depth analysis detailing your home's value as well as a comparison with similar homes in the area
Home Values in the Area
Average Home Value in this Area
Purchase History
| Date | Buyer | Sale Price | Title Company |
|---|---|---|---|
| Hila Ben Mergi Ofer | -- | None Available | |
| Ben Mergi Ofer | $155,000 | -- | |
| Vasquez Daniel | $167,000 | -- | |
| Parrella D A | $99,000 | -- |
Source: Public Records
Mortgage History
| Date | Status | Borrower | Loan Amount |
|---|---|---|---|
| Open | Ben Mergi Ofer | $124,000 | |
| Previous Owner | Vasquez Daniel | $161,990 |
Source: Public Records
Tax History Compared to Growth
Tax History
| Year | Tax Paid | Tax Assessment Tax Assessment Total Assessment is a certain percentage of the fair market value that is determined by local assessors to be the total taxable value of land and additions on the property. | Land | Improvement |
|---|---|---|---|---|
| 2025 | $2,924 | $363,200 | $120,000 | $243,200 |
| 2024 | $2,983 | $344,810 | $120,000 | $224,810 |
| 2023 | $2,885 | $329,660 | $120,000 | $209,660 |
| 2022 | $2,561 | $287,760 | $90,000 | $197,760 |
| 2021 | $2,591 | $264,370 | $85,000 | $179,370 |
| 2020 | $2,505 | $242,050 | $80,000 | $162,050 |
| 2019 | $2,277 | $217,870 | $45,000 | $172,870 |
| 2018 | $2,352 | $216,790 | $45,000 | $171,790 |
| 2017 | $2,329 | $207,050 | $45,000 | $162,050 |
| 2016 | $2,371 | $207,050 | $0 | $0 |
| 2015 | $2,375 | $164,220 | $0 | $164,220 |
| 2014 | $2,342 | $157,730 | $0 | $157,730 |
Source: Public Records
Map
Nearby Homes
- 21845 Baldwin Square Unit 101
- 46932 Courtyard Square
- 46893 Eaton Terrace Unit 300
- 46930 Trumpet Cir
- 304 E Gordon St
- 312 E Gordon St
- 1330 Rock Chapel Rd
- 130 Lakeland Dr
- 32 Cedar Dr
- 21439 Kenyon Ct
- 1551 Brownsville Dr
- 814 N Croydon St
- 0 Lake Dr
- 12406 Shallow Ford Ct
- 207 N Laura Anne Dr
- 104 W Amhurst Place
- 46823 Gunflint Way
- 1407 Skyhaven Ct
- 116 Lake Dr
- 46440 Beartown Dr
- 21845 Baldwin Square Unit 303
- 21845 Baldwin Square Unit 300
- 21845 Baldwin Square Unit 301
- 21845 Baldwin Square Unit 200
- 21845 Baldwin Square Unit 302
- 21843 Baldwin Square Unit 100
- 21843 Baldwin Square Unit 302
- 21843 Baldwin Square Unit 201
- 21843 Baldwin Square Unit 303
- 21843 Baldwin Square Unit 300
- 21843 Baldwin Square Unit 101
- 21843 Baldwin Square Unit 301
- 21843 Baldwin Square Unit 200
- 21841 Baldwin Square Unit 201
- 21841 Baldwin Square Unit 200
- 21841 Baldwin Square Unit 301
- 21841 Baldwin Square Unit 302
- 21841 Baldwin Square Unit 303
- 21841 Baldwin Square Unit 300
- 21841 Baldwin Square Unit 101