Estimated Value: $1,351,000 - $1,581,657
5
Beds
4
Baths
5,870
Sq Ft
$245/Sq Ft
Est. Value
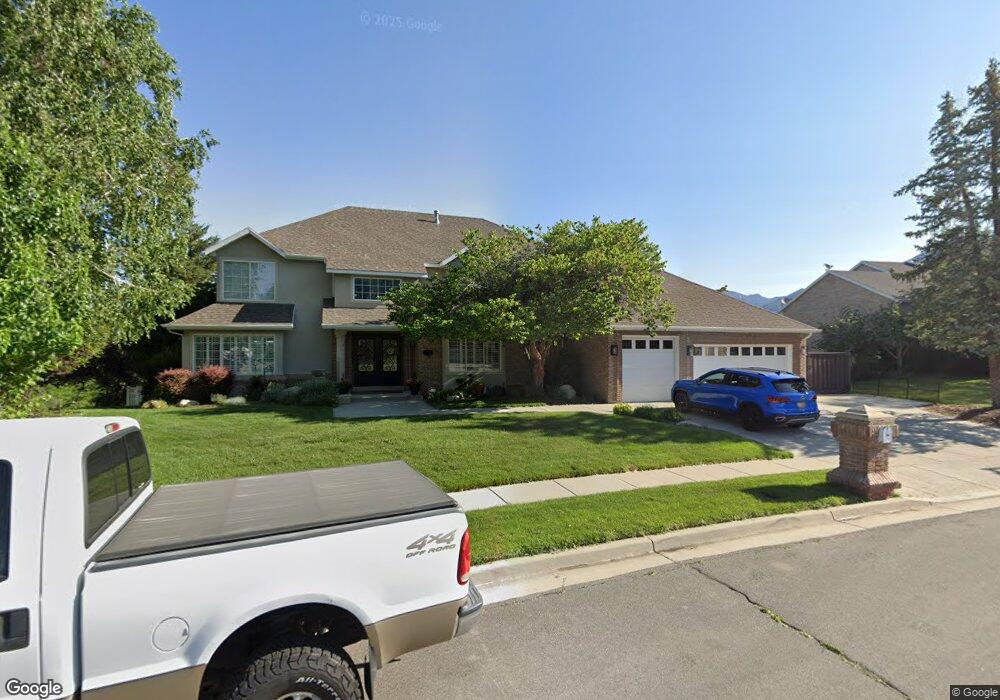
About This Home
This home is located at 2185 E High Ridge Ln, Sandy, UT 84092 and is currently estimated at $1,436,914, approximately $244 per square foot. 2185 E High Ridge Ln is a home located in Salt Lake County with nearby schools including Bell Canyon Montessori School and Challenger School - Sandy.
Ownership History
Date
Name
Owned For
Owner Type
Purchase Details
Closed on
Dec 30, 2013
Sold by
Overturf James L
Bought by
Carpenter Michael L and Carpenter Catherine J
Current Estimated Value
Home Financials for this Owner
Home Financials are based on the most recent Mortgage that was taken out on this home.
Original Mortgage
$162,000
Outstanding Balance
$121,261
Interest Rate
4.17%
Mortgage Type
Credit Line Revolving
Estimated Equity
$1,315,653
Purchase Details
Closed on
Jun 11, 2009
Sold by
Rackliffe William L and Rackliffe Karen S
Bought by
Foxbridge Partners Llc and Skidmore Craig J
Purchase Details
Closed on
Jul 15, 2005
Sold by
Skidmore Zara B
Bought by
Rackliffe William L and Rackliffe Karen S
Purchase Details
Closed on
Mar 30, 2005
Sold by
Overturf Jim and Overturf Jackie
Bought by
Overturf James L
Purchase Details
Closed on
Dec 26, 2002
Sold by
Taylor Properties Lc
Bought by
Davis David Robert and Davis Patricia S
Home Financials for this Owner
Home Financials are based on the most recent Mortgage that was taken out on this home.
Original Mortgage
$22,900
Interest Rate
5.24%
Mortgage Type
Stand Alone Second
Purchase Details
Closed on
Dec 29, 1999
Sold by
Powell Dean D
Bought by
Taylor Properties Lc
Purchase Details
Closed on
Nov 30, 1999
Sold by
Qwest Management Services Llc
Bought by
Powell Dean D
Purchase Details
Closed on
Aug 23, 1999
Sold by
Powell Dean D
Bought by
Qwest Management Services Llc
Home Financials for this Owner
Home Financials are based on the most recent Mortgage that was taken out on this home.
Original Mortgage
$223,530
Interest Rate
7.66%
Mortgage Type
Seller Take Back
Purchase Details
Closed on
Jul 15, 1999
Sold by
Taylor Thomas J
Bought by
Powell Dean D
Home Financials for this Owner
Home Financials are based on the most recent Mortgage that was taken out on this home.
Original Mortgage
$223,530
Interest Rate
7.66%
Mortgage Type
Seller Take Back
Purchase Details
Closed on
Sep 21, 1998
Sold by
Associates Relocation Management Co Inc
Bought by
Overturf Jim and Overturf Jackie
Purchase Details
Closed on
Apr 14, 1998
Sold by
Kubic Thomas T and Kubic Carol Ann
Bought by
Associates Relocation Management Co Inc
Purchase Details
Closed on
Jul 14, 1995
Sold by
Perry Homes Inc
Bought by
Kubic Thomas T and Kubic Carol Ann
Home Financials for this Owner
Home Financials are based on the most recent Mortgage that was taken out on this home.
Original Mortgage
$296,000
Interest Rate
7.74%
Create a Home Valuation Report for This Property
The Home Valuation Report is an in-depth analysis detailing your home's value as well as a comparison with similar homes in the area
Home Values in the Area
Average Home Value in this Area
Purchase History
| Date | Buyer | Sale Price | Title Company |
|---|---|---|---|
| Carpenter Michael L | -- | Cottonwood Title | |
| Foxbridge Partners Llc | -- | None Available | |
| Rackliffe William L | -- | -- | |
| Overturf James L | -- | -- | |
| Davis David Robert | -- | Integrated Title Ins Service | |
| Taylor Properties Lc | -- | Merrill Title | |
| Powell Dean D | -- | -- | |
| Qwest Management Services Llc | -- | Associated Title | |
| Powell Dean D | -- | -- | |
| Overturf Jim | -- | -- | |
| Associates Relocation Management Co Inc | -- | -- | |
| Kubic Thomas T | -- | -- | |
| Perry Homes Inc | -- | -- |
Source: Public Records
Mortgage History
| Date | Status | Borrower | Loan Amount |
|---|---|---|---|
| Open | Carpenter Michael L | $162,000 | |
| Open | Carpenter Michael L | $363,000 | |
| Previous Owner | Davis David Robert | $22,900 | |
| Previous Owner | Qwest Management Services Llc | $223,530 | |
| Previous Owner | Powell Dean D | $157,050 | |
| Previous Owner | Kubic Thomas T | $296,000 | |
| Closed | Powell Dean D | $66,480 |
Source: Public Records
Tax History
| Year | Tax Paid | Tax Assessment Tax Assessment Total Assessment is a certain percentage of the fair market value that is determined by local assessors to be the total taxable value of land and additions on the property. | Land | Improvement |
|---|---|---|---|---|
| 2025 | $6,281 | $1,221,900 | $781,800 | $440,100 |
| 2024 | $6,281 | $1,161,700 | $729,400 | $432,300 |
| 2023 | $6,281 | $1,005,600 | $665,200 | $340,400 |
| 2022 | $5,698 | $1,026,500 | $511,100 | $515,400 |
| 2021 | $5,572 | $854,400 | $480,100 | $374,300 |
| 2020 | $5,105 | $738,200 | $473,900 | $264,300 |
| 2019 | $5,234 | $737,600 | $473,900 | $263,700 |
| 2018 | $4,608 | $676,100 | $403,900 | $272,200 |
| 2017 | $4,662 | $653,500 | $403,900 | $249,600 |
| 2016 | $4,288 | $580,900 | $366,800 | $214,100 |
| 2015 | $4,372 | $548,100 | $345,900 | $202,200 |
| 2014 | $4,216 | $518,100 | $338,900 | $179,200 |
Source: Public Records
Map
Nearby Homes
- 2342 Charros Rd
- 16 Gatehouse Ln
- 2026 E 10765 S
- 10665 S 2340 E
- 5 Quietwood Ln
- 1 Quietwood Ln
- 7 Rollingwood Ln
- 11129 S 2125 E
- 1 Pepperwood Pointe
- 2009 E Sweetbriar Ln
- 2234 E Willow Brook Way
- 10286 S Edgecliff Dr
- 10868 Prescott Dr
- 2250 High Mountain Dr
- 11446 S 2320 E
- 11318 Canyon Falls Ln
- 2192 E High Mesa Dr
- 35 E Lone Hollow Dr
- 1602 E Sego Lily Dr
- 1 Cross Hill Ln
- 2185 High Ridge Ln
- 2197 E High Ridge Ln
- 2197 High Ridge Ln
- 2173 E High Ridge Ln
- 2173 High Ridge Ln
- 10732 Maple Hill Cir
- 2190 High Ridge Ln
- 10729 Maple Hill Cir
- 2215 E High Ridge Ln
- 2215 High Ridge Ln
- 2190 E High Ridge Ln
- 2176 High Ridge Ln
- 2167 High Ridge Ln
- 2204 High Ridge Ln
- 2204 E High Ridge Ln
- 10718 Maple Hill Cir
- 10788 S High Ridge Ln
- 2218 High Ridge Ln
- 10721 S Trailridge Cir
- 10721 S Trailridge Cir
Your Personal Tour Guide
Ask me questions while you tour the home.