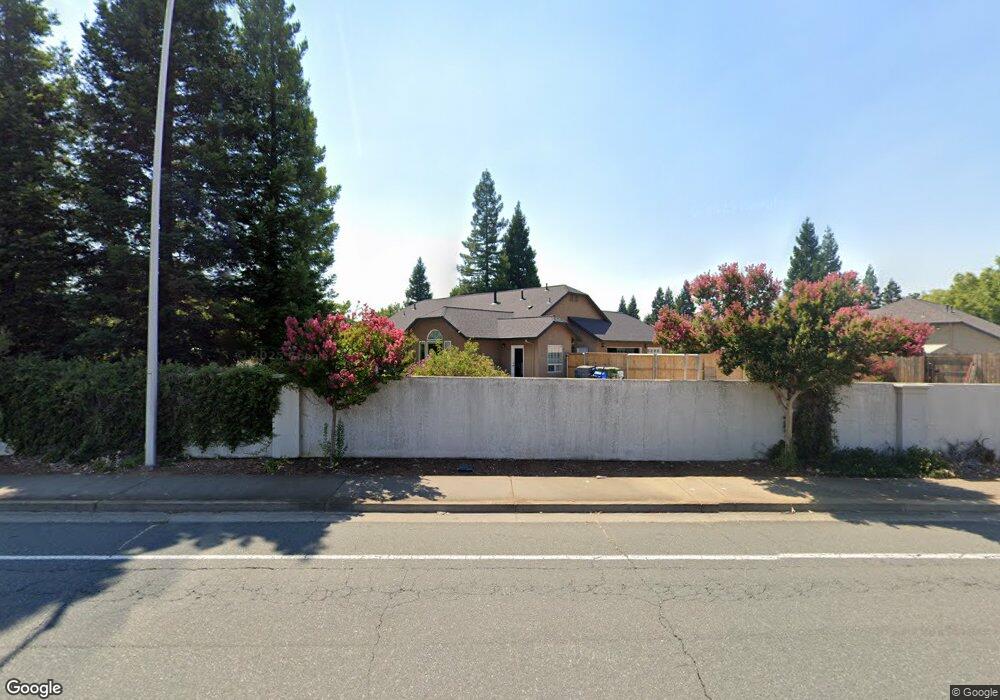
2189 Harvard Way Unit Lot 6 Redding, CA 96003
Simpson University Region NeighborhoodEstimated Value: $571,000 - $663,000
3
Beds
2
Baths
2,158
Sq Ft
$278/Sq Ft
Est. Value
About This Home
This home is located at 2189 Harvard Way Unit Lot 6, Redding, CA 96003 and is currently estimated at $600,308, approximately $278 per square foot. 2189 Harvard Way Unit Lot 6 is a home located in Shasta County with nearby schools including Columbia Elementary School, Mountain View Middle School, and Foothill High School.
Ownership History
Date
Name
Owned For
Owner Type
Purchase Details
Closed on
Dec 15, 2016
Sold by
Sockwell Aaron E and Sockwell Deborah J
Bought by
Sockwell Aaron Ewell and Sockwell Deborah Jean
Current Estimated Value
Purchase Details
Closed on
Oct 18, 2002
Sold by
Allen Jeb and Tsai Sue
Bought by
Sockwell Aaron E and Sockwell Deborah J
Home Financials for this Owner
Home Financials are based on the most recent Mortgage that was taken out on this home.
Original Mortgage
$229,440
Outstanding Balance
$85,327
Interest Rate
4.62%
Estimated Equity
$514,981
Purchase Details
Closed on
Dec 31, 2001
Sold by
Eckelman & Scarbrough Inc
Bought by
Allen Jeb and Tsai Sue
Home Financials for this Owner
Home Financials are based on the most recent Mortgage that was taken out on this home.
Original Mortgage
$384,000
Interest Rate
6.51%
Create a Home Valuation Report for This Property
The Home Valuation Report is an in-depth analysis detailing your home's value as well as a comparison with similar homes in the area
Home Values in the Area
Average Home Value in this Area
Purchase History
| Date | Buyer | Sale Price | Title Company |
|---|---|---|---|
| Sockwell Aaron Ewell | -- | None Available | |
| Sockwell Aaron E | $287,000 | Placer Title Company | |
| Allen Jeb | $576,000 | Placer Title Company |
Source: Public Records
Mortgage History
| Date | Status | Borrower | Loan Amount |
|---|---|---|---|
| Open | Sockwell Aaron E | $229,440 | |
| Previous Owner | Allen Jeb | $384,000 | |
| Closed | Sockwell Aaron E | $27,680 |
Source: Public Records
Tax History Compared to Growth
Tax History
| Year | Tax Paid | Tax Assessment Tax Assessment Total Assessment is a certain percentage of the fair market value that is determined by local assessors to be the total taxable value of land and additions on the property. | Land | Improvement |
|---|---|---|---|---|
| 2025 | $5,266 | $465,418 | $79,646 | $385,772 |
| 2024 | $5,276 | $456,293 | $78,085 | $378,208 |
| 2023 | $5,276 | $447,347 | $76,554 | $370,793 |
| 2022 | $5,093 | $438,576 | $75,053 | $363,523 |
| 2021 | $5,080 | $429,978 | $73,582 | $356,396 |
| 2020 | $4,999 | $425,570 | $72,828 | $352,742 |
| 2019 | $4,877 | $417,226 | $71,400 | $345,826 |
| 2018 | $4,947 | $409,046 | $70,000 | $339,046 |
| 2017 | $4,995 | $401,027 | $68,628 | $332,399 |
| 2016 | $4,524 | $375,000 | $75,000 | $300,000 |
| 2015 | $4,402 | $365,000 | $75,000 | $290,000 |
| 2014 | $3,940 | $330,000 | $60,000 | $270,000 |
Source: Public Records
Map
Nearby Homes
- 2154 Harvard Way
- 2147 Edinburgh Way
- 2110 Cilantro Dr
- 550 Armando Ave
- 40 Ortega Ct
- 006 Old Oregon Trail
- 693 Yolla Bolly Trail
- 1381 Chaos Walk
- 60 Rose Ln
- 624 Volcano View Trail
- 790 Volcano View Trail
- 19219 Nike Ct
- 667 Reddington Dr
- 1102 Hope Ln
- 774 Springer Dr
- 1187 Kirkwood Cir
- 1891 Edgewood Dr
- 1355 Hope Ln
- 11632 Ridgewood Rd
- 19660 Hendrika Way
- 2189 Harvard Way
- 2167 Harvard Way
- 2198 Harvard Way Unit 3
- 2172 Lafayette Ct Unit Lot 14
- 2172 Lafayette Ct
- 2145 Harvard Way Unit Lot 8
- 2145 Harvard Way
- 2150 Lafayette Ct Unit Lot 13
- 2150 Lafayette Ct
- 2176 Harvard Way Unit Lot 4
- 2176 Harvard Way
- 2172 Harvard Way Unit Lot 14
- 2194 Lafayette Ct Unit Lot 15
- 2194 Lafayette Ct
- 2123 Harvard Way
- 2183 Princeton Way
- 2128 Lafayette Ct Unit 3
- 2132 Harvard Way Unit Lot 2
- 2132 Harvard Way
- 2165 Princeton Way