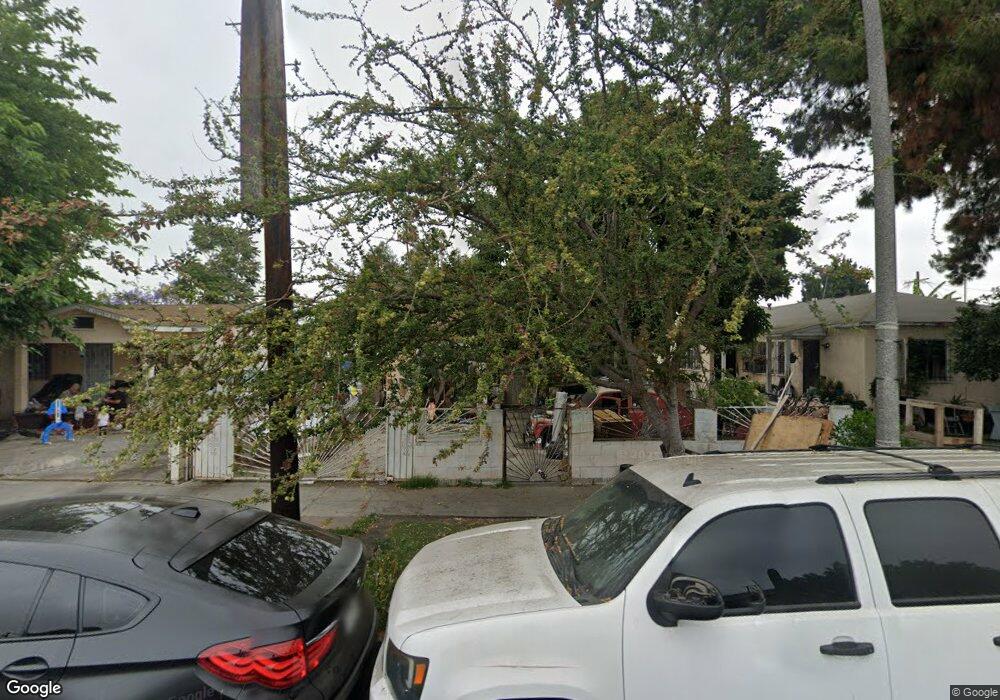
219 E 79th St Los Angeles, CA 90003
Florence NeighborhoodEstimated Value: $613,000 - $713,000
6
Beds
4
Baths
1,396
Sq Ft
$474/Sq Ft
Est. Value
About This Home
This home is located at 219 E 79th St, Los Angeles, CA 90003 and is currently estimated at $662,354, approximately $474 per square foot. 219 E 79th St is a home located in Los Angeles County with nearby schools including Seventy-Fifth Street Elementary School, Mary McLeod Bethune Middle School, and Academy For Multiligual Arts And Science At Mervyn M. Dymally High.
Ownership History
Date
Name
Owned For
Owner Type
Purchase Details
Closed on
Feb 26, 2026
Sold by
Soloache Medina Adriana and Elainne Gonzalez-Soloache Lesley
Bought by
Gonzalez-Soloache Lesley Elainne and Gonzalez Erick Fernando
Current Estimated Value
Purchase Details
Closed on
Oct 29, 2002
Sold by
Almaraz Santos
Bought by
Almaraz Santos
Purchase Details
Closed on
May 22, 1998
Sold by
Moreno Fernando
Bought by
Almaraz J Santos
Home Financials for this Owner
Home Financials are based on the most recent Mortgage that was taken out on this home.
Original Mortgage
$103,550
Interest Rate
6.95%
Purchase Details
Closed on
Nov 14, 1996
Sold by
Moreno Obdulia
Bought by
Moreno Fernando
Home Financials for this Owner
Home Financials are based on the most recent Mortgage that was taken out on this home.
Original Mortgage
$51,200
Interest Rate
4.25%
Purchase Details
Closed on
Oct 31, 1996
Sold by
Alexander Arlene
Bought by
Moreno Fernando
Home Financials for this Owner
Home Financials are based on the most recent Mortgage that was taken out on this home.
Original Mortgage
$51,200
Interest Rate
4.25%
Create a Home Valuation Report for This Property
The Home Valuation Report is an in-depth analysis detailing your home's value as well as a comparison with similar homes in the area
Home Values in the Area
Average Home Value in this Area
Purchase History
| Date | Buyer | Sale Price | Title Company |
|---|---|---|---|
| Gonzalez-Soloache Lesley Elainne | -- | None Listed On Document | |
| Almaraz Santos | -- | -- | |
| Almaraz J Santos | $109,000 | Fidelity National Title | |
| Moreno Fernando | -- | Fidelity National Title Ins | |
| Moreno Fernando | $64,000 | Fidelity National Title Ins |
Source: Public Records
Mortgage History
| Date | Status | Borrower | Loan Amount |
|---|---|---|---|
| Previous Owner | Almaraz J Santos | $103,550 | |
| Previous Owner | Moreno Fernando | $51,200 |
Source: Public Records
Tax History
| Year | Tax Paid | Tax Assessment Tax Assessment Total Assessment is a certain percentage of the fair market value that is determined by local assessors to be the total taxable value of land and additions on the property. | Land | Improvement |
|---|---|---|---|---|
| 2025 | $5,617 | $266,148 | $119,447 | $146,701 |
| 2024 | $5,617 | $260,930 | $117,105 | $143,825 |
| 2023 | $5,555 | $255,814 | $114,809 | $141,005 |
| 2022 | $5,394 | $250,799 | $112,558 | $138,241 |
| 2021 | $5,350 | $245,882 | $110,351 | $135,531 |
| 2019 | $5,259 | $238,591 | $107,079 | $131,512 |
| 2018 | $5,176 | $233,914 | $104,980 | $128,934 |
| 2016 | $6,422 | $224,832 | $100,904 | $123,928 |
| 2015 | $2,816 | $221,456 | $99,389 | $122,067 |
| 2014 | $2,833 | $217,119 | $97,443 | $119,676 |
Source: Public Records
Map
Nearby Homes
- 127 E 81st St
- 8115 S San Pedro St
- 7913 Main St
- 332 E 79th St
- 135 E 77th St
- 8110 S San Pedro St
- 8111 S Main St
- 8019 Towne Ave
- 154 E 82nd Place
- 8226 S Main St
- 7908 Towne Ave
- 8021 Towne Ave
- 124 E 76th St
- 131 W 77th St
- 315 - 317 W 66th St
- 155 157 W 103 St
- 314 - 316 W 65th St
- 147 - 149 E 105th St
- 227 229 E 81st
- 341 343 E 104th St
Your Personal Tour Guide
Ask me questions while you tour the home.