Estimated payment $1,241/month
Highlights
- Deck
- Quartz Countertops
- Porch
- Traditional Architecture
- No HOA
- Walk-In Closet
About This Home
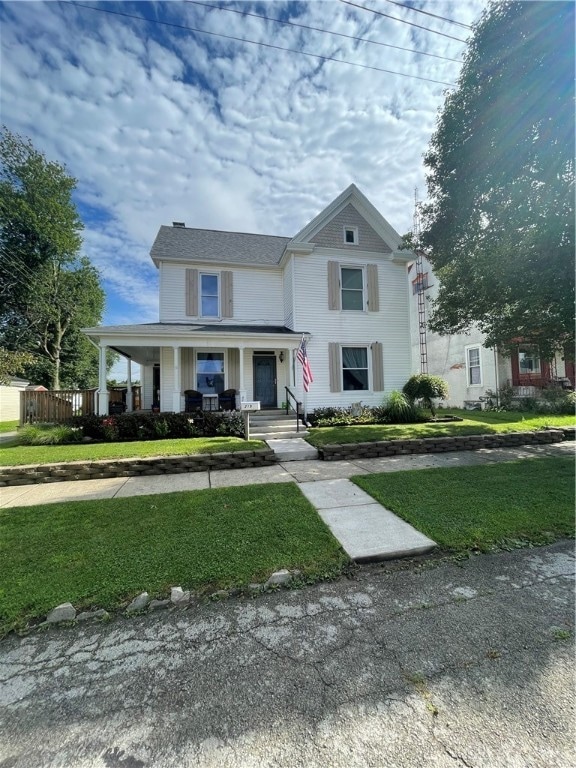
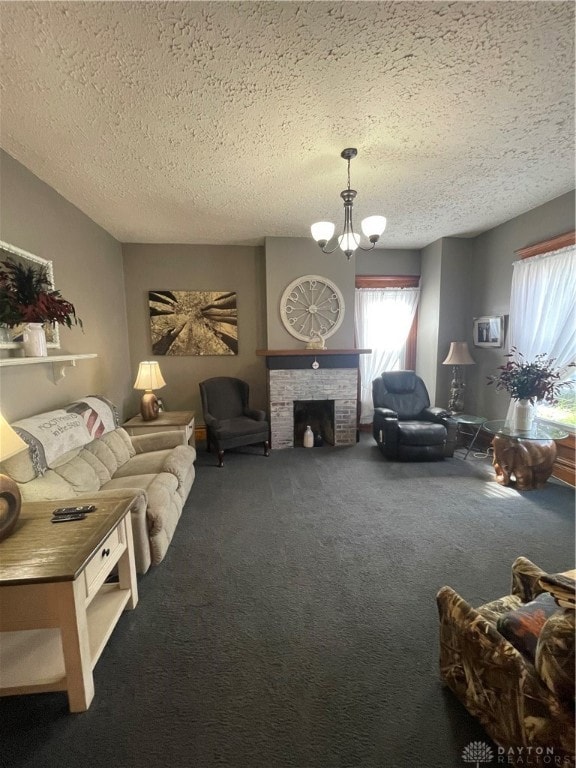
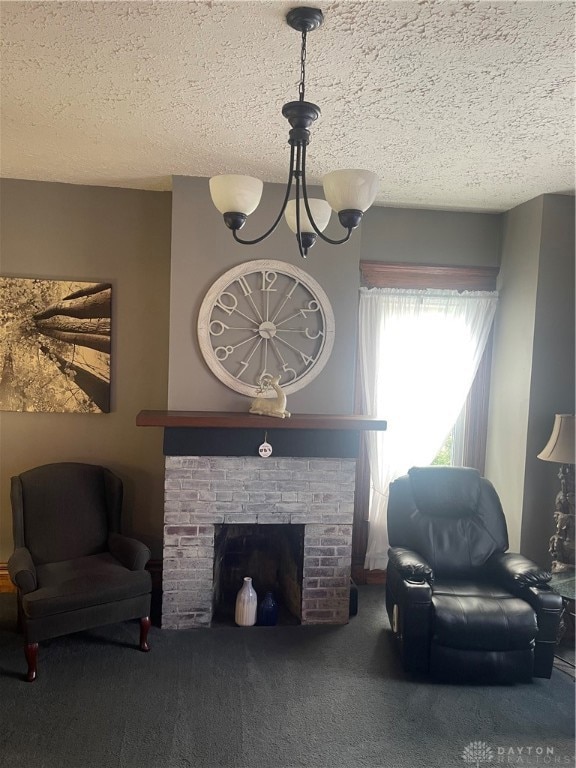
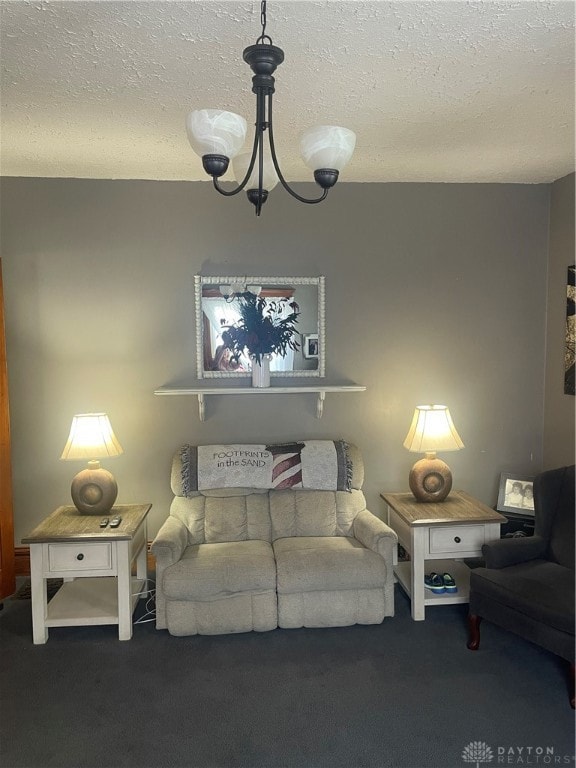
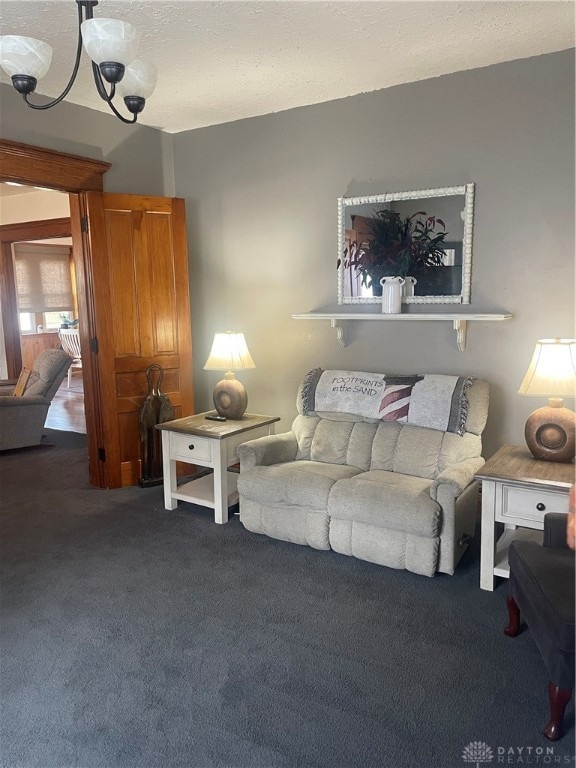
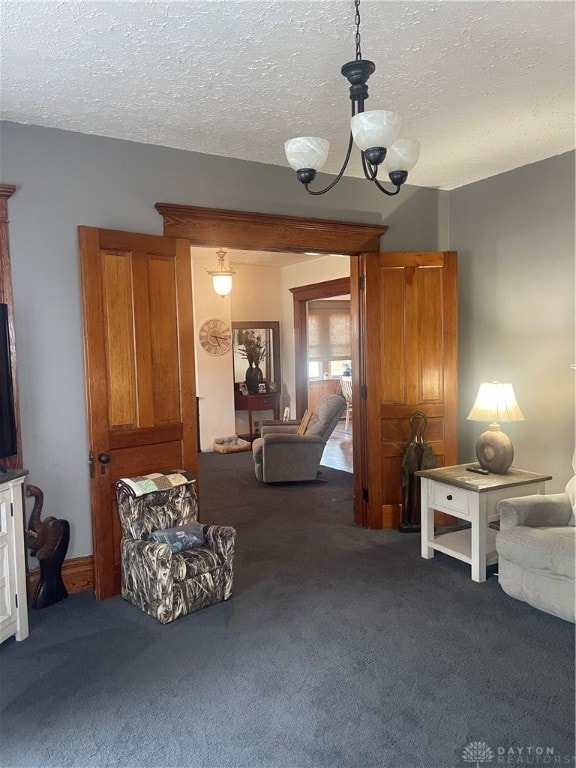
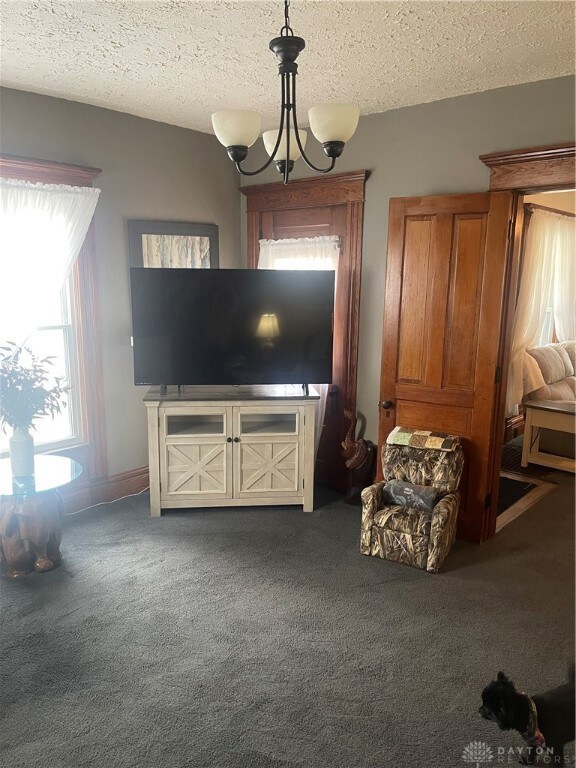
Welcome to this beautifully maintained 3 bedroom and 2.5 bath home.Offering 1849 square feet of timeless charm and modern convenience, featuring gorgeous natural woodwork throughout. The kitchen boasts quartz counter tops, beautiful new floors throughout house. On suite on 1st floor, you'll be delighted with the updated look and walk in closet. Upstairs you'll find 2 large bedrooms, one with the added enjoyment of a over sized walk in closet. The upstairs has a attractive mini full bathroom. The home has had the following work: roof replace with in last 2 years, new HVAC system, water heater and softener. For your convenience the Washer and dryer on on the main floor. Home has a unfinished basement, Home sits a a double lot. Attic is large enough to stand up in and has lots of storage. MUST SEE, Ready to move in home.
Listing Agent
Country Mile REALTORS Brokerage Phone: (937) 456-9992 License #2013003513 Listed on: 07/21/2025
Home Details
Home Type
- Single Family
Est. Annual Taxes
- $1,604
Year Built
- 1940
Lot Details
- 0.26 Acre Lot
Parking
- No Garage
Home Design
- Traditional Architecture
- Frame Construction
- Vinyl Siding
Interior Spaces
- 1,849 Sq Ft Home
- 2-Story Property
- Gas Fireplace
- Vinyl Clad Windows
- Insulated Windows
- Double Hung Windows
- Basement Cellar
Kitchen
- Range
- Dishwasher
- Quartz Countertops
Bedrooms and Bathrooms
- 3 Bedrooms
- Walk-In Closet
- Bathroom on Main Level
Outdoor Features
- Deck
- Shed
- Porch
Utilities
- Forced Air Heating and Cooling System
- Heating System Uses Natural Gas
- Gas Water Heater
- High Speed Internet
Community Details
- No Home Owners Association
- Al Haris Subdivision
Listing and Financial Details
- Assessor Parcel Number M40000604901003000
Map
Home Values in the Area
Average Home Value in this Area
Tax History
| Year | Tax Paid | Tax Assessment Tax Assessment Total Assessment is a certain percentage of the fair market value that is determined by local assessors to be the total taxable value of land and additions on the property. | Land | Improvement |
|---|---|---|---|---|
| 2024 | $1,604 | $45,020 | $8,300 | $36,720 |
| 2023 | $1,604 | $45,020 | $8,300 | $36,720 |
| 2022 | $1,600 | $37,180 | $7,600 | $29,580 |
| 2021 | $1,680 | $37,180 | $7,600 | $29,580 |
| 2020 | $1,600 | $36,760 | $7,600 | $29,160 |
| 2019 | $1,268 | $28,430 | $6,340 | $22,090 |
| 2018 | $1,306 | $28,430 | $6,340 | $22,090 |
| 2017 | $1,161 | $28,430 | $6,340 | $22,090 |
| 2016 | $1,015 | $23,460 | $6,340 | $17,120 |
| 2014 | $999 | $23,460 | $6,340 | $17,120 |
| 2013 | $1,089 | $24,920 | $6,335 | $18,585 |
Property History
| Date | Event | Price | List to Sale | Price per Sq Ft |
|---|---|---|---|---|
| 10/07/2025 10/07/25 | Price Changed | $210,000 | -4.5% | $114 / Sq Ft |
| 09/23/2025 09/23/25 | Price Changed | $219,900 | +1.3% | $119 / Sq Ft |
| 09/20/2025 09/20/25 | For Sale | $217,000 | 0.0% | $117 / Sq Ft |
| 09/17/2025 09/17/25 | Off Market | $217,000 | -- | -- |
| 09/02/2025 09/02/25 | Price Changed | $217,000 | -3.6% | $117 / Sq Ft |
| 08/15/2025 08/15/25 | For Sale | $225,000 | 0.0% | $122 / Sq Ft |
| 08/11/2025 08/11/25 | Pending | -- | -- | -- |
| 07/21/2025 07/21/25 | For Sale | $225,000 | -- | $122 / Sq Ft |
Purchase History
| Date | Type | Sale Price | Title Company |
|---|---|---|---|
| Warranty Deed | $109,000 | Freedom Title Company Inc | |
| Warranty Deed | $82,000 | Swo Title | |
| Deed | $53,000 | -- |
Mortgage History
| Date | Status | Loan Amount | Loan Type |
|---|---|---|---|
| Open | $103,143 | FHA | |
| Previous Owner | $81,900 | FHA | |
| Previous Owner | $53,374 | FHA |
Source: Dayton REALTORS®
MLS Number: 939458
APN: M40-0006-0-4-90-100-3000
Disclaimer: Certain information contained herein is derived from information provided by parties other than Homes.com. All information provided is deemed reliable, but is not guaranteed to be accurate and should be independently verified.
![]() The information is being provided by Dayton Area Board of Realtors MLS. Information deemed reliable but not guaranteed. Information is provided for the consumer's personal, non-commercial use, and may not be used for any purpose other than the identification of potential properties for purchase. Copyright 2025 Dayton Area Board of Realtors MLS. All Rights Reserved.
The information is being provided by Dayton Area Board of Realtors MLS. Information deemed reliable but not guaranteed. Information is provided for the consumer's personal, non-commercial use, and may not be used for any purpose other than the identification of potential properties for purchase. Copyright 2025 Dayton Area Board of Realtors MLS. All Rights Reserved.
- 0-00 Washington Jackson Rd
- 125 E Decatur St
- 115 E Decatur St
- 612 N Cherry St
- 111 W High St
- 233 N Barron St
- 124 Deem St
- 217 E Eidson St
- 300 Aukerman St
- 405 Walnut St
- 117 Vine St
- 0 N Walnut St Unit 947156
- 308 Hubble St
- 1008 N Maple St
- 218 S Cherry St
- 919 N Barron St
- 130 E Chicago St
- 210 W Spring St
- 105 Leatherman Place
- 230 W Spring St
- 4 N Shawnee Plains Ct
- 111 Swanson Dr
- 207 W Walnut St
- 50 Ridge Rd
- 700 Pleasant Ct
- 3735 S A St
- 501 Hayes Arboretum Rd
- 15 Clinchfield Ct
- 114 N 34th St
- 115 Market St Unit 1
- 115 Sycamore St Unit D
- 1032 S 23rd St
- 642 S 23rd St
- 1300 S 18th St
- 318 N 21st St
- 326 1/2 S 12th St
- 200 S 8th St
- 133 S 7th St Unit 133 down
- 131 S 7th St Unit 131 Up
- 401 N 10th St
