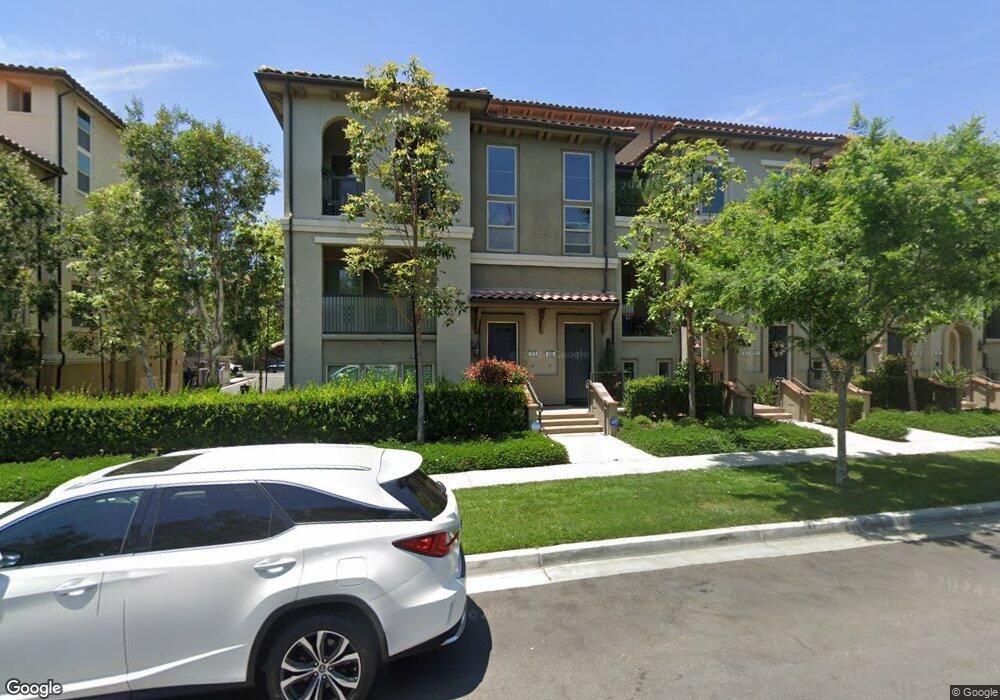
219 Native Spring Irvine, CA 92618
Portola Springs NeighborhoodEstimated Value: $856,000 - $917,714
2
Beds
3
Baths
1,245
Sq Ft
$716/Sq Ft
Est. Value
About This Home
This home is located at 219 Native Spring, Irvine, CA 92618 and is currently estimated at $890,929, approximately $715 per square foot. 219 Native Spring is a home located in Orange County with nearby schools including Portola Springs Elementary, Jeffrey Trail Middle, and Portola High School.
Ownership History
Date
Name
Owned For
Owner Type
Purchase Details
Closed on
Jun 10, 2025
Sold by
Boyalife Asset Holding Ii Inc
Current Estimated Value
Home Financials for this Owner
Home Financials are based on the most recent Mortgage that was taken out on this home.
Original Mortgage
$704,000
Outstanding Balance
$697,443
Interest Rate
5.9%
Mortgage Type
New Conventional
Estimated Equity
$193,486
Purchase Details
Closed on
Mar 24, 2021
Sold by
Zhu Haihong
Bought by
Boyalife Asset Holding Ii Inc
Purchase Details
Closed on
Dec 23, 2019
Sold by
Lee Dong S and Yoo Kyung S
Bought by
Zhu Haihong
Home Financials for this Owner
Home Financials are based on the most recent Mortgage that was taken out on this home.
Original Mortgage
$419,000
Interest Rate
3.73%
Mortgage Type
New Conventional
Create a Home Valuation Report for This Property
The Home Valuation Report is an in-depth analysis detailing your home's value as well as a comparison with similar homes in the area
Home Values in the Area
Average Home Value in this Area
Purchase History
| Date | Buyer | Sale Price | Title Company |
|---|---|---|---|
| -- | $880,000 | Fidelity National Title | |
| Boyalife Asset Holding Ii Inc | $570,000 | First American Title Company | |
| Zhu Haihong | $569,000 | Chicago Title |
Source: Public Records
Mortgage History
| Date | Status | Borrower | Loan Amount |
|---|---|---|---|
| Open | -- | $704,000 | |
| Previous Owner | Zhu Haihong | $419,000 |
Source: Public Records
Tax History
| Year | Tax Paid | Tax Assessment Tax Assessment Total Assessment is a certain percentage of the fair market value that is determined by local assessors to be the total taxable value of land and additions on the property. | Land | Improvement |
|---|---|---|---|---|
| 2025 | $9,108 | $616,985 | $372,017 | $244,968 |
| 2024 | $9,108 | $604,888 | $364,723 | $240,165 |
| 2023 | $8,959 | $593,028 | $357,572 | $235,456 |
| 2022 | $8,840 | $581,400 | $350,560 | $230,840 |
| 2021 | $8,695 | $574,894 | $349,932 | $224,962 |
| 2020 | $8,631 | $562,254 | $343,509 | $218,745 |
| 2019 | $8,582 | $551,230 | $336,774 | $214,456 |
| 2018 | $8,706 | $540,422 | $330,171 | $210,251 |
| 2017 | $8,592 | $529,826 | $323,697 | $206,129 |
| 2016 | $8,352 | $519,438 | $317,350 | $202,088 |
Source: Public Records
Map
Nearby Homes
Your Personal Tour Guide
Ask me questions while you tour the home.