
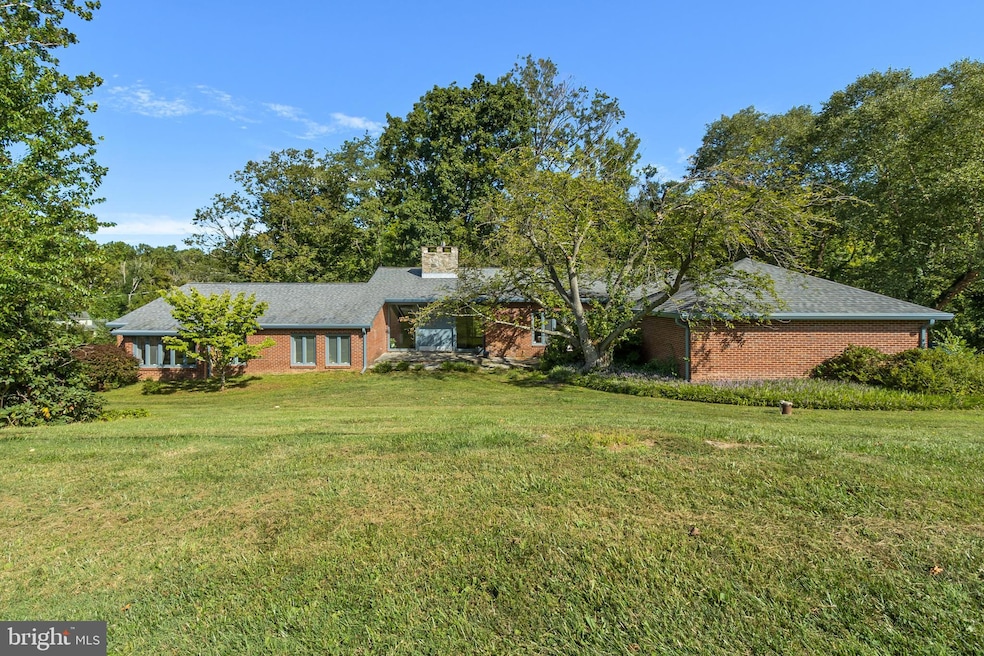
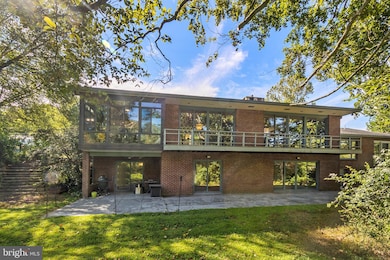
22 Covered Bridge Ln Newark, DE 19711
Pike Creek Neighborhood
4
Beds
4
Baths
3,600
Sq Ft
1.07
Acres
Highlights
- 1.07 Acre Lot
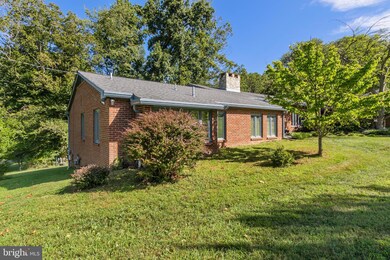
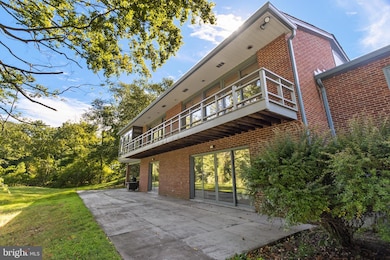
- Rambler Architecture
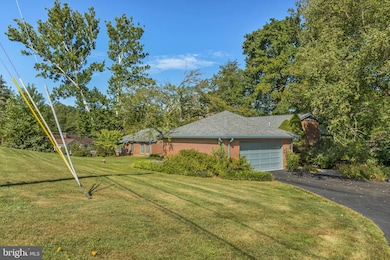
- 2 Car Detached Garage
- Recreation Room
- Den
- Butlers Pantry
About This Home
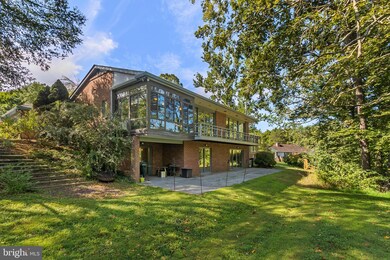
As of October 2023This stunning, mid century, modern style, all Brick Ranch Home in Desirable Covered Bridge Farms , sold before processing. These owners have lovingly updated many features of this home thinking they would never leave. Only a job transfer made this home available. Numerous updates since they purchased the home. Home features approximately 3600+ square feet of finished space. Entering into the dramatic foyer with slate floor, stone wall and 9 ft ceilings, you know you are in a truly unique property! This home was made for entertaining! Sellers have hosted many wonderful neighborhood parties and events in this home and are sad to be leaving! Covered Bridge Farms is minutes to Downtown Newark, University of Delaware, Newark train Station, Newark Charter, I-95 and Christina Hospital and Christiana Mall. Attached in documents is the full upgrade list.
Home Details
Home Type
- Single Family
Est. Annual Taxes
- $6,140
Year Built
- Built in 1969
Lot Details
- 1.07 Acre Lot
- Lot Dimensions are 245.90 x 220.00
- Property is zoned NC21
HOA Fees
- $41 Monthly HOA Fees
Parking
- 2 Car Detached Garage
- Side Facing Garage
Home Design
- Rambler Architecture
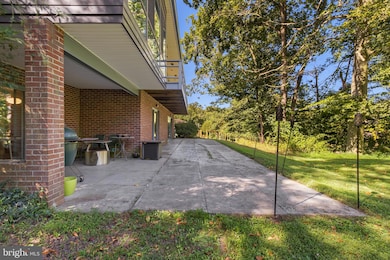
- Brick Exterior Construction
- Block Foundation
Interior Spaces
- Property has 2 Levels
- Bar
- Ceiling Fan
- Recessed Lighting
- Family Room
- Living Room
- Dining Room
- Den
- Recreation Room
- Natural lighting in basement
- Butlers Pantry
- Laundry Room
Bedrooms and Bathrooms
- 4 Main Level Bedrooms
- En-Suite Primary Bedroom
Utilities
- 90% Forced Air Heating and Cooling System
- Cooling System Utilizes Natural Gas
- Water Treatment System
- Well
- Natural Gas Water Heater
- Mound Septic
Community Details
- Covered Bridge Farms Subdivision
Listing and Financial Details
- Tax Lot 042
- Assessor Parcel Number 09-007.10-042
Ownership History
Date
Name
Owned For
Owner Type
Purchase Details
Listed on
Sep 22, 2023
Closed on
Oct 7, 2023
Sold by
Tice Daniel B and Konkol Leah
Bought by
Mijatovic-Kovacevic Natalija and Kovacevic Blazo
Seller's Agent
Mary Kate Johnston
RE/MAX Associates - Newark
Buyer's Agent
Mary Kate Johnston
RE/MAX Associates - Newark
List Price
$635,000
Sold Price
$635,000
Current Estimated Value
Home Financials for this Owner
Home Financials are based on the most recent Mortgage that was taken out on this home.
Estimated Appreciation
$14,099
Avg. Annual Appreciation
1.58%
Original Mortgage
$317,500
Interest Rate
7.31%
Mortgage Type
New Conventional
Purchase Details
Listed on
Aug 8, 2016
Closed on
Oct 25, 2016
Sold by
Little Louise V and Rasmussen Arlette I
Bought by
Tice Daniel B and Konkol Leah
Seller's Agent
Steve Altshuler
Patterson-Schwartz-Newark
Buyer's Agent
Julianna Conomon
RE/MAX Associates-Wilmington
List Price
$379,900
Sold Price
$340,000
Premium/Discount to List
-$39,900
-10.5%
Home Financials for this Owner
Home Financials are based on the most recent Mortgage that was taken out on this home.
Avg. Annual Appreciation
9.36%
Original Mortgage
$323,000
Interest Rate
3.42%
Mortgage Type
New Conventional
Purchase Details
Closed on
Jun 14, 2000
Bought by
Little Louise and Rasmussen Arlette
Similar Homes in the area
Create a Home Valuation Report for This Property
The Home Valuation Report is an in-depth analysis detailing your home's value as well as a comparison with similar homes in the area
Home Values in the Area
Average Home Value in this Area
Purchase History
| Date | Type | Sale Price | Title Company |
|---|---|---|---|
| Deed | $635,000 | None Listed On Document | |
| Deed | $340,000 | None Available | |
| Deed | -- | -- |
Source: Public Records
Mortgage History
| Date | Status | Loan Amount | Loan Type |
|---|---|---|---|
| Open | $322,000 | New Conventional | |
| Closed | $317,500 | New Conventional | |
| Previous Owner | $79,000 | Credit Line Revolving | |
| Previous Owner | $328,454 | New Conventional | |
| Previous Owner | $30,000 | Stand Alone Second | |
| Previous Owner | $323,000 | New Conventional | |
| Previous Owner | $307,500 | Stand Alone Refi Refinance Of Original Loan |
Source: Public Records
Property History
| Date | Event | Price | Change | Sq Ft Price |
|---|---|---|---|---|
| 10/20/2023 10/20/23 | Sold | $635,000 | 0.0% | $176 / Sq Ft |
| 09/22/2023 09/22/23 | For Sale | $635,000 | +86.8% | $176 / Sq Ft |
| 08/29/2023 08/29/23 | Pending | -- | -- | -- |
| 10/27/2016 10/27/16 | Sold | $340,000 | -5.5% | $94 / Sq Ft |
| 09/17/2016 09/17/16 | Pending | -- | -- | -- |
| 09/06/2016 09/06/16 | Price Changed | $359,900 | -5.3% | $100 / Sq Ft |
| 08/08/2016 08/08/16 | For Sale | $379,900 | -- | $106 / Sq Ft |
Source: Bright MLS
Tax History Compared to Growth
Tax History
| Year | Tax Paid | Tax Assessment Tax Assessment Total Assessment is a certain percentage of the fair market value that is determined by local assessors to be the total taxable value of land and additions on the property. | Land | Improvement |
|---|---|---|---|---|
| 2024 | $6,328 | $148,600 | $29,100 | $119,500 |
| 2023 | $6,154 | $148,600 | $29,100 | $119,500 |
| 2022 | $6,140 | $148,600 | $29,100 | $119,500 |
| 2021 | $6,010 | $148,600 | $29,100 | $119,500 |
| 2020 | $5,854 | $148,600 | $29,100 | $119,500 |
| 2019 | $5,173 | $148,600 | $29,100 | $119,500 |
| 2018 | $5,038 | $148,600 | $29,100 | $119,500 |
| 2017 | $4,859 | $148,600 | $29,100 | $119,500 |
| 2016 | $4,347 | $148,600 | $29,100 | $119,500 |
| 2015 | -- | $148,600 | $29,100 | $119,500 |
| 2014 | -- | $148,600 | $29,100 | $119,500 |
Source: Public Records
Agents Affiliated with this Home
-
Mary Kate Johnston
Seller's Agent in 2023
Mary Kate Johnston
RE/MAX
(302) 388-5654
30 in this area
150 Total Sales
-
Steve Altshuler
S
Seller's Agent in 2016
Steve Altshuler
Patterson Schwartz
3 in this area
14 Total Sales
-
Julianna Conomon
Buyer's Agent in 2016
Julianna Conomon
RE/MAX
(302) 220-8080
54 Total Sales
Map
Source: Bright MLS
MLS Number: DENC2048686
APN: 09-007.10-042
Disclaimer: Certain information contained herein is derived from information provided by parties other than Homes.com. All information provided is deemed reliable, but is not guaranteed to be accurate and should be independently verified.
![]() The data relating to real estate for sale on this website appears in part through the BRIGHT Internet Data Exchange program, a voluntary cooperative exchange of property listing data between licensed real estate brokerage firms, and is provided by BRIGHT through a licensing agreement.
The data relating to real estate for sale on this website appears in part through the BRIGHT Internet Data Exchange program, a voluntary cooperative exchange of property listing data between licensed real estate brokerage firms, and is provided by BRIGHT through a licensing agreement.
Listing information is from various brokers who participate in the Bright MLS IDX program and not all listings may be visible on the site.
The property information being provided on or through the website is for the personal, non-commercial use of consumers and such information may not be used for any purpose other than to identify prospective properties consumers may be interested in purchasing.
Some properties which appear for sale on the website may no longer be available because they are for instance, under contract, sold or are no longer being offered for sale.
Property information displayed is deemed reliable but is not guaranteed.
Copyright 2025 Bright MLS, Inc.
Nearby Homes
- 322 Wallace Dr
- 208 Atlanta Ct
- 74 Hidden Valley Dr
- 211 Ashley Dr
- 19 E Mill Station Dr
- 17 E Mill Station Dr
- 130 W Mill Station Dr
- 12 Hempsted Dr
- 65 Jackson Hall School Rd
- 118 Red Pine Cir
- 803 Cambridge Dr
- 102 Joshua (6 Building Lots) Ln
- 202 Wilshire Ln
- 207 Wilshire Ln
- 302 Stamford Dr
- 505 Windsor Dr
- 3 Lisa Ct
- 520 Hopkins Bridge Rd
- 27 Fremont Rd
- 148 Ballantrae Dr