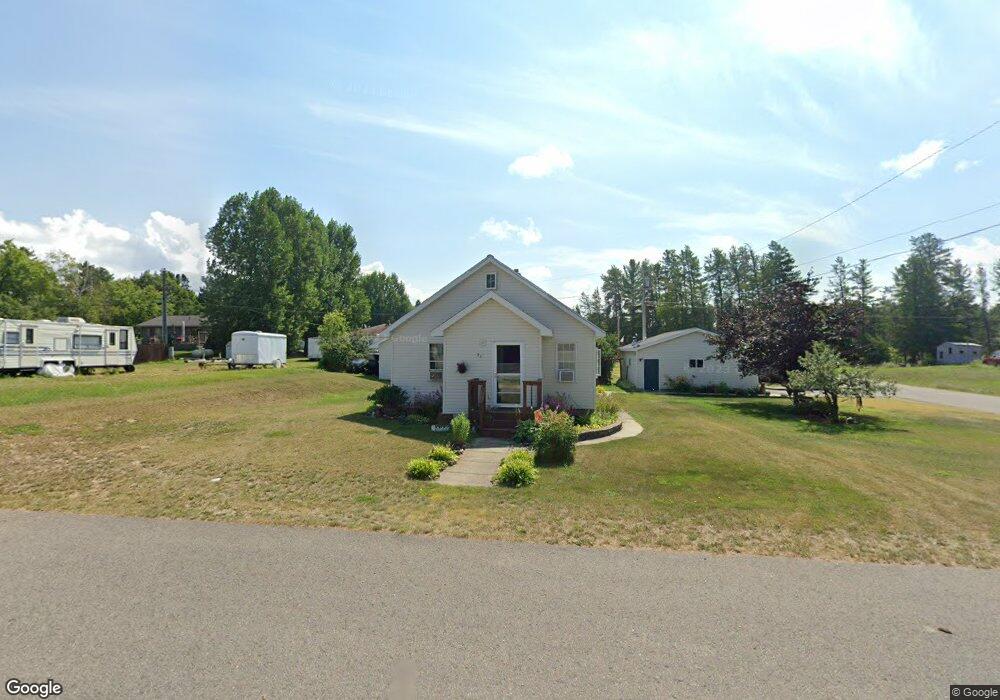
22 Fifth Ave Soudan, MN 55782
Soudan NeighborhoodEstimated Value: $118,000 - $152,000
2
Beds
2
Baths
1,140
Sq Ft
$124/Sq Ft
Est. Value
About This Home
This home is located at 22 Fifth Ave, Soudan, MN 55782 and is currently estimated at $141,555, approximately $124 per square foot. 22 Fifth Ave is a home with nearby schools including Tower-Soudan Elementary School and Vermilion Country School.
Ownership History
Date
Name
Owned For
Owner Type
Purchase Details
Closed on
May 24, 2016
Sold by
Poderzay John M and Poderzay Julie A
Bought by
Poderzay Jared R and Poderzay Justin M
Current Estimated Value
Purchase Details
Closed on
Dec 3, 2013
Sold by
Poderzay John M and Poderzay Julie
Bought by
Podersay John M and Poderzay Julie A
Home Financials for this Owner
Home Financials are based on the most recent Mortgage that was taken out on this home.
Original Mortgage
$15,500
Interest Rate
4.38%
Mortgage Type
Purchase Money Mortgage
Create a Home Valuation Report for This Property
The Home Valuation Report is an in-depth analysis detailing your home's value as well as a comparison with similar homes in the area
Home Values in the Area
Average Home Value in this Area
Purchase History
| Date | Buyer | Sale Price | Title Company |
|---|---|---|---|
| Poderzay Jared R | -- | Attorney | |
| Podersay John M | -- | Northeast Title Company |
Source: Public Records
Mortgage History
| Date | Status | Borrower | Loan Amount |
|---|---|---|---|
| Closed | Podersay John M | $15,500 |
Source: Public Records
Tax History
| Year | Tax Paid | Tax Assessment Tax Assessment Total Assessment is a certain percentage of the fair market value that is determined by local assessors to be the total taxable value of land and additions on the property. | Land | Improvement |
|---|---|---|---|---|
| 2024 | $554 | $119,800 | $8,000 | $111,800 |
| 2023 | $554 | $124,100 | $8,000 | $116,100 |
| 2022 | $782 | $103,200 | $7,600 | $95,600 |
| 2021 | $780 | $98,400 | $7,200 | $91,200 |
| 2020 | $768 | $98,400 | $7,200 | $91,200 |
| 2019 | $510 | $98,000 | $7,200 | $90,800 |
| 2018 | $378 | $83,900 | $6,800 | $77,100 |
| 2017 | $344 | $72,700 | $6,100 | $66,600 |
| 2016 | $348 | $69,200 | $5,700 | $63,500 |
| 2015 | $311 | $38,200 | $3,400 | $34,800 |
| 2014 | $311 | $39,000 | $3,400 | $35,600 |
Source: Public Records
Map
Nearby Homes
Your Personal Tour Guide
Ask me questions while you tour the home.