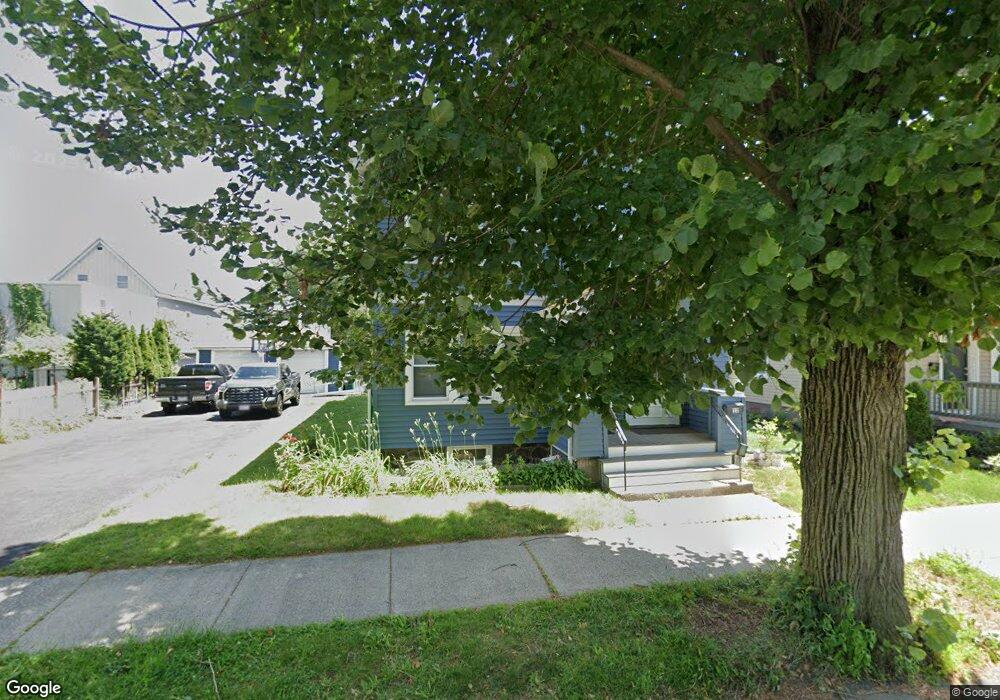
22 Rand St Lynn, MA 01904
Agganis AC NeighborhoodEstimated Value: $780,022 - $904,000
4
Beds
2
Baths
3,086
Sq Ft
$272/Sq Ft
Est. Value
About This Home
This home is located at 22 Rand St, Lynn, MA 01904 and is currently estimated at $838,756, approximately $271 per square foot. 22 Rand St is a home located in Essex County with nearby schools including Edward A. Sisson Elementary School, William R. Fallon School, and Pickering Middle School.
Ownership History
Date
Name
Owned For
Owner Type
Purchase Details
Closed on
Dec 8, 2020
Sold by
Pech Sokun
Bought by
Hathaway Ft 2020 and Pech
Current Estimated Value
Purchase Details
Closed on
May 1, 2009
Sold by
Hathaway Steven C
Bought by
Pech Sokun
Home Financials for this Owner
Home Financials are based on the most recent Mortgage that was taken out on this home.
Original Mortgage
$160,000
Interest Rate
4.86%
Mortgage Type
Purchase Money Mortgage
Purchase Details
Closed on
Jul 30, 1999
Sold by
Estes Kenneth G and Estes Donna E
Bought by
Hathaway Steven C
Home Financials for this Owner
Home Financials are based on the most recent Mortgage that was taken out on this home.
Original Mortgage
$147,000
Interest Rate
7.61%
Mortgage Type
Purchase Money Mortgage
Create a Home Valuation Report for This Property
The Home Valuation Report is an in-depth analysis detailing your home's value as well as a comparison with similar homes in the area
Home Values in the Area
Average Home Value in this Area
Purchase History
| Date | Buyer | Sale Price | Title Company |
|---|---|---|---|
| Hathaway Ft 2020 | -- | None Available | |
| Pech Sokun | $200,000 | -- | |
| Pech Sokun | $200,000 | -- | |
| Hathaway Steven C | $182,000 | -- | |
| Hathaway Steven C | $182,000 | -- |
Source: Public Records
Mortgage History
| Date | Status | Borrower | Loan Amount |
|---|---|---|---|
| Previous Owner | Pech Sokun | $160,000 | |
| Previous Owner | Hathaway Steven C | $185,998 | |
| Previous Owner | Hathaway Steven C | $147,000 | |
| Previous Owner | Hathaway Steven C | $90,000 |
Source: Public Records
Tax History
| Year | Tax Paid | Tax Assessment Tax Assessment Total Assessment is a certain percentage of the fair market value that is determined by local assessors to be the total taxable value of land and additions on the property. | Land | Improvement |
|---|---|---|---|---|
| 2025 | $8,542 | $824,496 | $203,600 | $620,896 |
| 2024 | $8,148 | $773,800 | $199,000 | $574,800 |
| 2023 | $8,048 | $721,800 | $187,100 | $534,700 |
| 2022 | $8,000 | $643,600 | $147,100 | $496,500 |
| 2021 | $7,707 | $591,500 | $148,900 | $442,600 |
| 2020 | $7,040 | $525,400 | $134,200 | $391,200 |
| 2019 | $6,581 | $460,200 | $126,400 | $333,800 |
| 2018 | $6,048 | $399,200 | $117,700 | $281,500 |
| 2017 | $5,761 | $369,300 | $103,900 | $265,400 |
| 2016 | $5,352 | $330,800 | $96,100 | $234,700 |
| 2015 | $5,201 | $310,500 | $102,000 | $208,500 |
Source: Public Records
Map
Nearby Homes
- 10 Pond St
- 2 Chestnut Terrace
- 479 Broadway
- 325 Western Ave
- 345 Western Ave
- 5 Rockingham St
- 12 W Colony Rd
- 70 Grant St
- 198 Locust St Unit 303
- 200 Locust St Unit 706
- 200 Locust St Unit 106
- 135 Allen Ave
- 531 A Chatham St
- 70 Allen Ave
- 15 Nichols Ave
- 199 Allen Ave
- 6A Goodridge St
- 49 Eade St
- 6-8 Beede Ave
- 129 Eutaw Ave
Your Personal Tour Guide
Ask me questions while you tour the home.