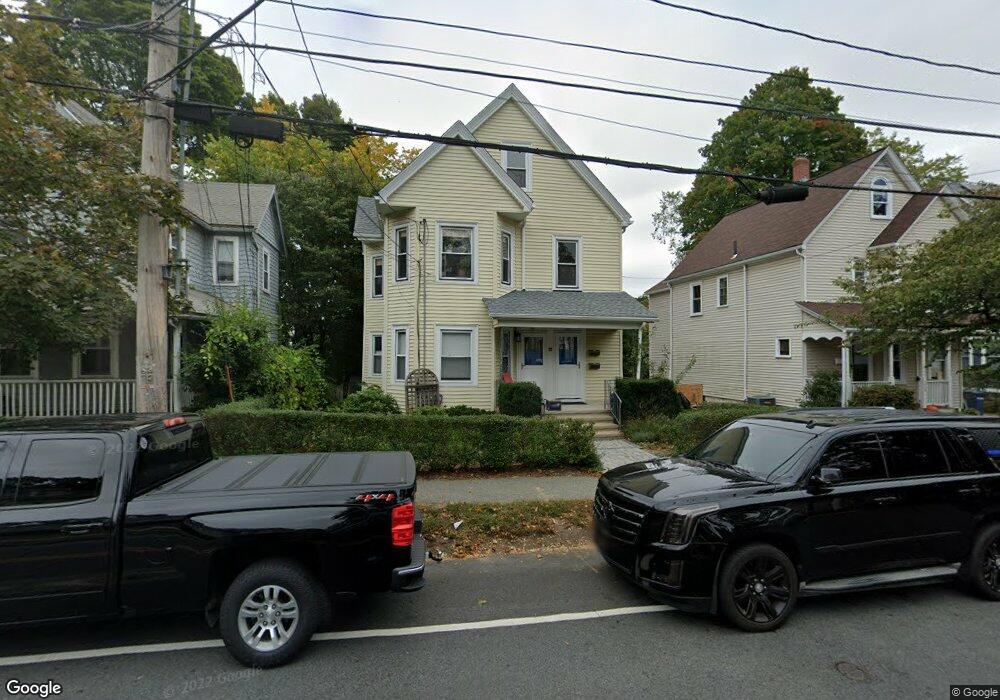
220 Cherry St West Newton, MA 02465
West Newton NeighborhoodEstimated Value: $1,062,000 - $1,110,414
4
Beds
2
Baths
1,746
Sq Ft
$623/Sq Ft
Est. Value
About This Home
This home is located at 220 Cherry St, West Newton, MA 02465 and is currently estimated at $1,088,104, approximately $623 per square foot. 220 Cherry St is a home located in Middlesex County with nearby schools including Franklin Elementary School, F.A. Day Middle School, and Newton North High School.
Ownership History
Date
Name
Owned For
Owner Type
Purchase Details
Closed on
Dec 19, 2023
Sold by
Kantola Angeline R
Bought by
Angeline R Kantola 2023 T R and Angeline Kantola
Current Estimated Value
Purchase Details
Closed on
Dec 19, 2016
Sold by
Kantola Angeline R and Stevens Richard C
Bought by
Kantola Angeline R
Purchase Details
Closed on
May 13, 2004
Sold by
Clancy Paula J and Clancy Richard T
Bought by
Cherry Street Nt and Clancy
Create a Home Valuation Report for This Property
The Home Valuation Report is an in-depth analysis detailing your home's value as well as a comparison with similar homes in the area
Home Values in the Area
Average Home Value in this Area
Purchase History
| Date | Buyer | Sale Price | Title Company |
|---|---|---|---|
| Angeline R Kantola 2023 T R | -- | None Available | |
| Kantola Angeline R | -- | -- | |
| Cherry Street Nt | -- | -- |
Source: Public Records
Tax History Compared to Growth
Tax History
| Year | Tax Paid | Tax Assessment Tax Assessment Total Assessment is a certain percentage of the fair market value that is determined by local assessors to be the total taxable value of land and additions on the property. | Land | Improvement |
|---|---|---|---|---|
| 2025 | $8,416 | $858,800 | $609,300 | $249,500 |
| 2024 | $8,138 | $833,800 | $591,600 | $242,200 |
| 2023 | $7,754 | $761,700 | $469,900 | $291,800 |
| 2022 | $7,420 | $705,300 | $435,100 | $270,200 |
| 2021 | $6,963 | $647,100 | $399,200 | $247,900 |
| 2020 | $6,756 | $647,100 | $399,200 | $247,900 |
| 2019 | $6,320 | $604,800 | $373,100 | $231,700 |
| 2018 | $6,291 | $581,400 | $352,800 | $228,600 |
| 2017 | $5,931 | $533,400 | $323,700 | $209,700 |
| 2016 | $5,569 | $489,400 | $297,000 | $192,400 |
| 2015 | $5,310 | $457,400 | $277,600 | $179,800 |
Source: Public Records
Map
Nearby Homes
- 41 Kilburn Rd
- 287 Cherry St Unit 2
- 44 Westland Ave
- 56 Dearborn St
- 14 Cottage Place Unit 14
- 75 Cherry St
- 106 River St Unit 18
- 106 River St Unit 2
- 106 River St Unit 14
- 2 Elm St Unit 6
- 2 Elm St Unit 8
- 371 Cherry St
- 76 Taft Ave Unit 1
- 76 Taft Ave
- 76 Taft Ave Unit 2
- 76 Harding St
- 265-267 River St Unit 267
- 265-267 River St Unit 265
- 24 Tolman St Unit A
- 90 Auburndale Ave
- 220 Cherry St
- 224 Cherry St
- 216 Cherry St
- 228 Cherry St
- 17 Talbot St
- 212 Cherry St
- 21 Talbot St
- 11 Talbot St
- 232 Cherry St Unit 234
- 208 Cherry St
- 27-29 Talbot St
- 27-29 Talbot St Unit 2ND FLR
- 27 Talbot St Unit 29
- 27 Talbot St Unit 2nd Floor
- 215 Cherry St Unit 217
- 217 Cherry St Unit 217
- 215 Cherry St Unit 215
- 215 Cherry St Unit 1
- 227 Cherry St
- 5 Talbot St