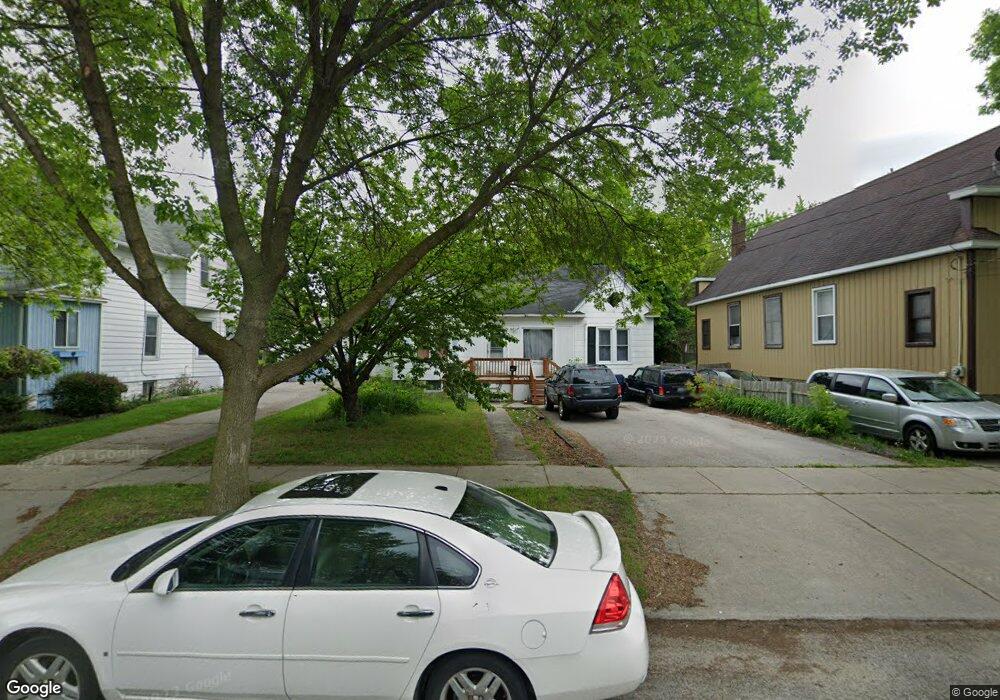
220 N Sherman St Bay City, MI 48708
Estimated Value: $93,000 - $124,000
2
Beds
1
Bath
1,026
Sq Ft
$109/Sq Ft
Est. Value
About This Home
This home is located at 220 N Sherman St, Bay City, MI 48708 and is currently estimated at $111,982, approximately $109 per square foot. 220 N Sherman St is a home located in Bay County with nearby schools including Washington Elementary School, Handy Middle School, and Bay City Central High School.
Ownership History
Date
Name
Owned For
Owner Type
Purchase Details
Closed on
May 16, 2006
Sold by
Whitman Myron and Whitman Patricia E
Bought by
Risselada Rhonda
Current Estimated Value
Home Financials for this Owner
Home Financials are based on the most recent Mortgage that was taken out on this home.
Original Mortgage
$68,000
Outstanding Balance
$43,080
Interest Rate
8.1%
Mortgage Type
Fannie Mae Freddie Mac
Estimated Equity
$68,902
Purchase Details
Closed on
Feb 28, 2002
Sold by
Redwanz Margaret A
Bought by
Whitman Myron and Whitman Patricia E
Purchase Details
Closed on
May 7, 1998
Sold by
Anaman Emil G
Bought by
Redwanz Margaret A
Purchase Details
Closed on
Jul 27, 1993
Sold by
Runyan Dave and Heinz Nancy Jo
Bought by
Anaman Emil G
Purchase Details
Closed on
Jul 17, 1993
Bought by
Runyan Dane and Heinz Nancy Jo
Purchase Details
Closed on
Apr 17, 1992
Sold by
Valderas Jose L and Valderas Ann M
Bought by
Runyan Dane and Heinz Nancy Jo
Purchase Details
Closed on
Aug 9, 1989
Sold by
Niedzielski J Peter
Bought by
Valderas Jose L and Valderas Ann M
Create a Home Valuation Report for This Property
The Home Valuation Report is an in-depth analysis detailing your home's value as well as a comparison with similar homes in the area
Home Values in the Area
Average Home Value in this Area
Purchase History
| Date | Buyer | Sale Price | Title Company |
|---|---|---|---|
| Risselada Rhonda | $85,000 | None Available | |
| Whitman Myron | $76,000 | -- | |
| Redwanz Margaret A | $52,300 | -- | |
| Anaman Emil G | $35,700 | -- | |
| Runyan Dane | $17,000 | -- | |
| Runyan Dane | $17,000 | -- | |
| Valderas Jose L | $23,000 | -- |
Source: Public Records
Mortgage History
| Date | Status | Borrower | Loan Amount |
|---|---|---|---|
| Open | Risselada Rhonda | $68,000 | |
| Closed | Risselada Rhonda | $17,000 |
Source: Public Records
Tax History Compared to Growth
Tax History
| Year | Tax Paid | Tax Assessment Tax Assessment Total Assessment is a certain percentage of the fair market value that is determined by local assessors to be the total taxable value of land and additions on the property. | Land | Improvement |
|---|---|---|---|---|
| 2025 | $1,483 | $50,900 | $0 | $0 |
| 2024 | $1,221 | $45,450 | $0 | $0 |
| 2023 | $1,162 | $37,350 | $0 | $0 |
| 2022 | $1,335 | $32,600 | $0 | $0 |
| 2021 | $1,255 | $31,000 | $2,100 | $28,900 |
| 2020 | $1,335 | $28,000 | $2,100 | $25,900 |
| 2019 | $1,306 | $27,450 | $0 | $0 |
| 2018 | $1,293 | $26,800 | $0 | $0 |
| 2017 | $1,265 | $26,650 | $0 | $0 |
| 2016 | $1,258 | $25,550 | $2,100 | $23,450 |
| 2015 | $1,471 | $25,600 | $2,100 | $23,500 |
| 2014 | $1,471 | $30,850 | $2,100 | $28,750 |
Source: Public Records
Map
Nearby Homes
- 302 N Farragut St
- 208 S Sheridan St
- 1517 11th St
- 251 N Van Buren St
- 301 N Van Buren St
- 321 N Birney St
- 510 N Farragut St
- 609 11th St
- 1712 10th St
- 224 N Madison Ave
- 1713 9th St
- 1010 6th Street 6th St
- 309 Harold St
- 904 6th St
- 501 S Mclellan St
- 1708 6th St
- 620 S Mclellan St
- 1213 Center Ave
- 701 15th St
- 909 Center Ave
- 218 N Sherman St
- 230 N Sherman St
- 234 N Sherman St
- 225 N Sheridan St
- 216 N Sherman St
- 227 N Sheridan St
- 238 N Sherman St
- 229 N Sheridan St
- 223 N Sherman St
- 213 N Sheridan St
- 231 N Sherman St
- 221 N Sherman St
- 233 N Sherman St
- 214 N Sherman St
- 239 N Sheridan St
- 219 N Sherman St
- 242 N Sherman St
- 211 N Sheridan St
- 235 N Sherman St
- 217 N Sherman St